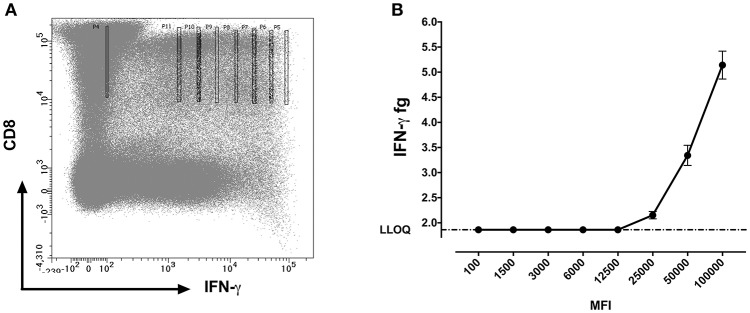
Figure 5.
IFN-γ protein quantification at different mean fluorescent intensities (MFI). (A) Flow cytometry dot plot showing gating strategy for sorting CD8+IFN-γ+ cells at different MFI's using bin gating. The gates were set as such that the MFI values fall in a range of 100,000 with 8 different intensities following a two-fold incremental order and covering from the brightest to the dimmest IFN-γ expression on CD8 cells (B) Measured amounts of IFN-γ from cells sorted from various levels of staining for cells surface IFN-γ expressed as mean ± SD fluorescence intensity channel numbers (MFI).

