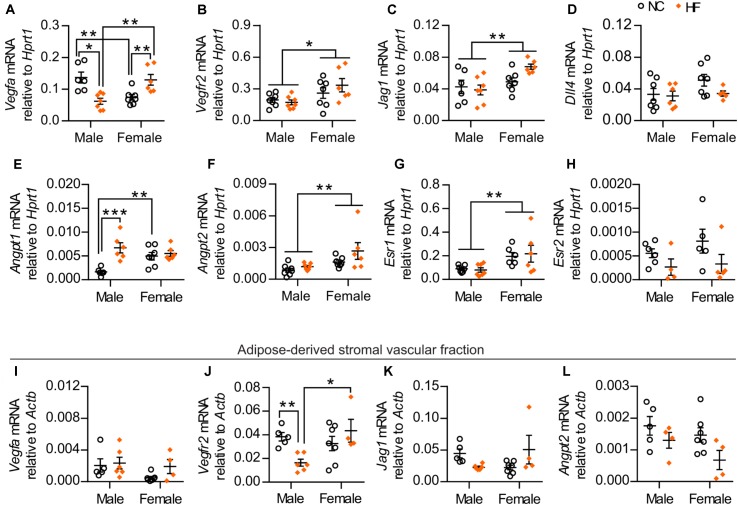
FIGURE 7.
HF-fed female mice show higher levels of pro-angiogenic markers and estrogen receptor 1 in pgWAT. (A–H) pgWAT gene expression analysis by qPCR. (I–L) qPCR analysis of the adipose tissue-derived stromal vascular fraction. Data in all panels are expressed as mean ± SEM. ∗P < 0.05, ∗∗P < 0.01 for main sex effect by two-way ANOVA model (B,C,F,G), ∗P < 0.05, ∗∗P < 0.01, ∗∗∗P < 0.001, post hoc Bonferroni-corrected t-tests when a statistical sex x diet interaction significance was detected by the two-way ANOVA model (A,E,J).

