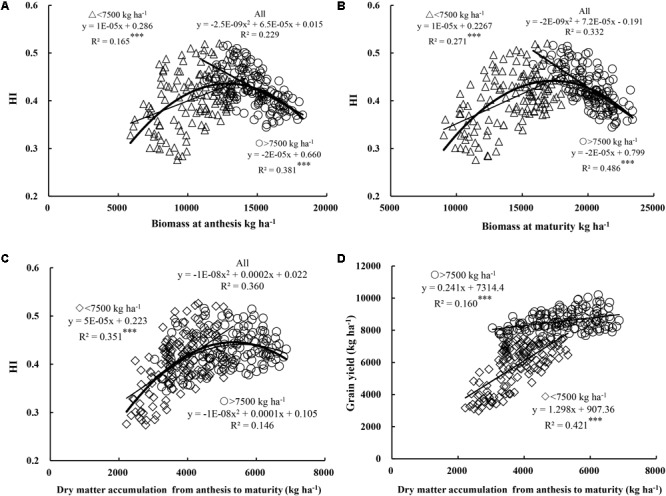
FIGURE 3.

Relationships between harvest index (HI) and biomass at anthesis (A) and maturity (B), and relationships between DM accumulation from anthesis to maturity and HI (C) and grain yield (D), respectively. Significant at ∗p = 0.05, ∗∗p = 0.01, and ∗∗∗p = 0.001.
