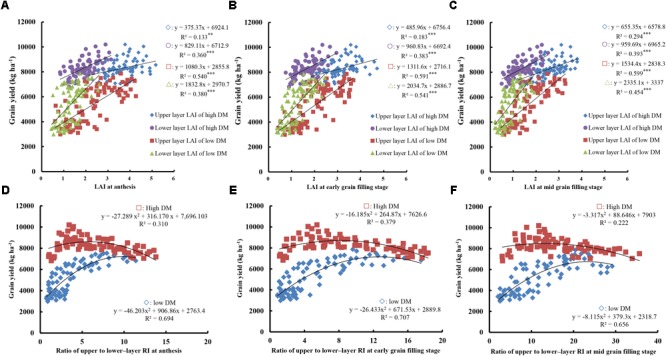
FIGURE 5.

Relationships between grain yield and the ratio of upper- to lower-layer RI, and LAI at anthesis, early, and mid-grain filling. (A–C) Relationships between yield and LAI at anthesis (A), early grain filling stage, (B) and mid grain filling stage (C). (D–F) Relationships between yield and ratio of upper- to lower-layer RI at anthesis (D), early grain filling stage, (E) and mid grain filling stage (F). High DM, DM at anthesis >13,000 kg ha-1; low DM, DM at anthesis <13,000 kg ha-1. Significant at ∗p = 0.05, ∗∗p = 0.01, and ∗∗∗p = 0.001.
