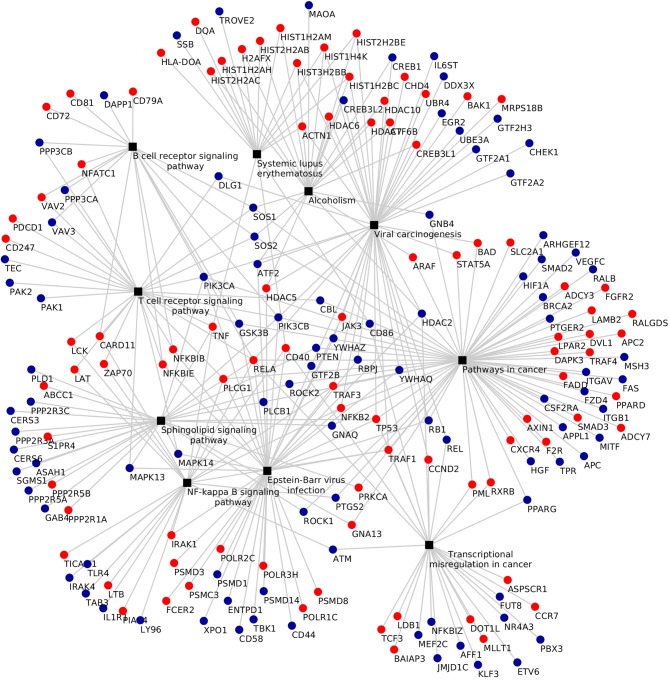
Figure 6.
Enriched KEGG pathways in the Adj Tf vs. Adj T0 comparison in DAVID with EASE Score (a modified Fisher's exact test) and Benjamini-Hochberg False Discovery Rate correction. Black boxes represent different pathways and the points the differentially expressed genes in each pathway, up-regulated ones in red and down-regulated ones in blue.

