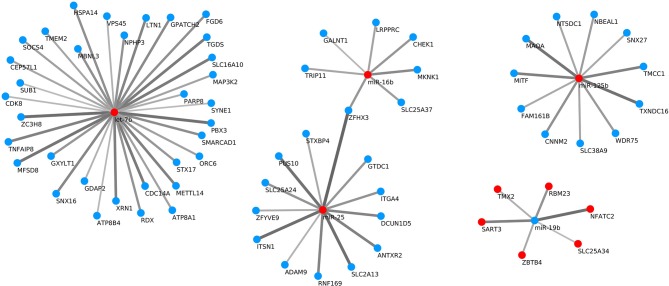
Figure 9.
Significant negative correlations (with an adjusted p-value < 0.05) between differentially expressed miRNA-target pairs. Red points represent up-regulation and blue ones down-regulation of the miRNA or target gene. The greater the absolute value of the Spearman's rank correlation coefficient (rho), the broader and darker is the line joining the miRNA and predicted target.

