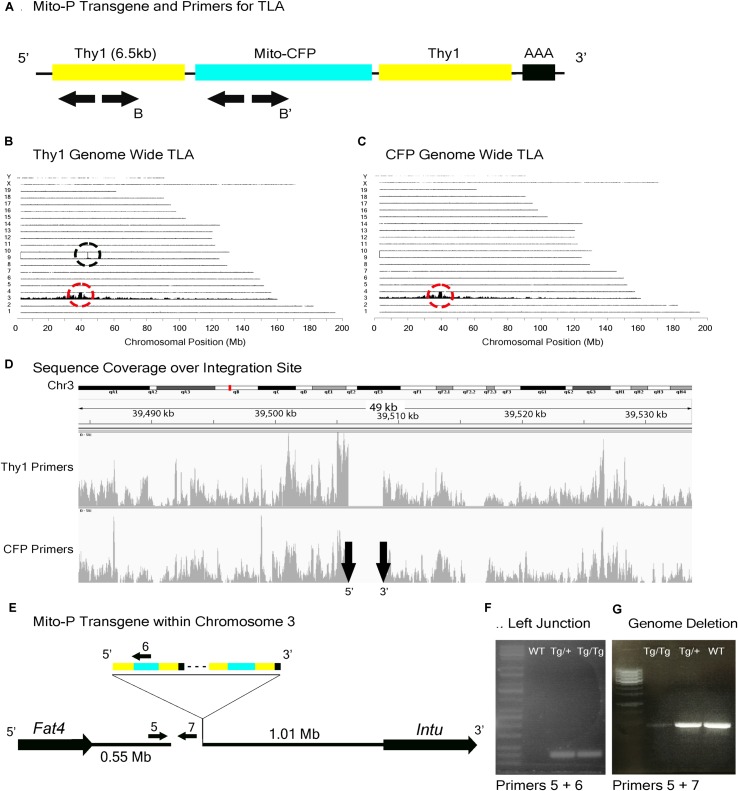
FIGURE 4.
Mito-P locus identification. (A) Schematic of the Mito-P transgene, showing positions of primers used for TLA. Primer sets were designed within the Thy1 sequence and within the CFP sequence. (B) Genome-wide TLA coverage using Thy1 primers. Peak at Chromosome 9 shows endogenous Thy1 (black circle) and peak at Chromosome 3 shows inserted sequence (red circle). (C) Genome-wide TLA coverage using CFP primers, with a peak at Chromosome 3 showing the inserted sequence (red circle). (D) Regional coverage of the Mito-P insertion site on Chromosome 3 using both sets of primers, showing a 3 kb deletion and spanning 49 kb. (E) Schematic of the inserted sequence. The transgene was inserted multiple times between Fat4 and Intu in Chromosome 3, in the 5′ to 3′ direction. Primers were designed to confirm the left junction of the transgene to Chromosome 3, as well as the predicted deletion. PCR product from homozygous Mito-P, heterozygous Mito-P, and C57BL/6J animals is denoted as “Tg/Tg,” “Tg/+,” “WT” respectively. (F) Primers 5 and 6 were used to confirm the junction between the transgene and Chromosome 3 in heterozygous and homozygous animals. (G) Primers 5 and 7 were used to confirm the deletion engendered by the transgene. The band is absent in putative homozygous Mito-P animals.

