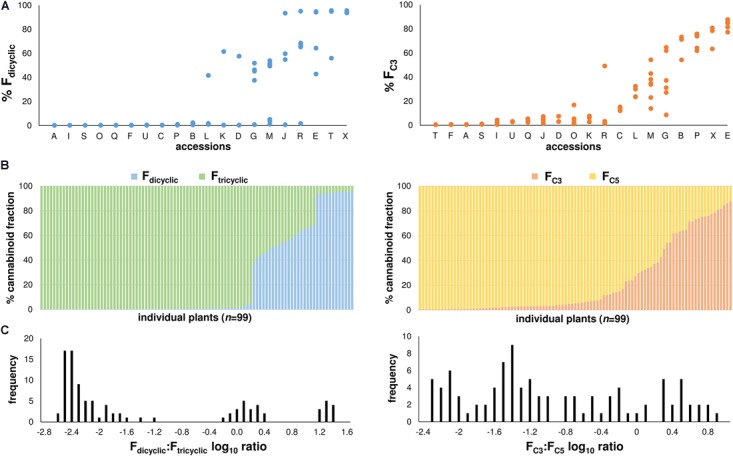
FIGURE 3.

(A) Fdicyclic as well as FC3 chemotypic variation of mature plants within accessions. Accessions ordered on the x-axis from low to high chemotypic values. Fdicyclic as well as FC3 values on the y-axis describe the relative abundance of dicyclic as well as C3-alkyl cannabinoid fractions. Letters specify accession ID (Table 1). (B) Distribution patterns of the major Fdicyclic/Ftricyclic as well as FC3/FC5 values of 99 Cannabis plants at maturation. Individual plants ordered on the x-axis from low to high Fdicyclic as well as FC3 chemotypic values. Fdicyclic/Ftricyclic as well as FC3/FC5 values on the y-axis describe the relative abundance of dicyclic as well as C3-alkyl cannabinoid fractions. (C) Fdicyclic: Ftricyclic as well as FC3: FC5 log10 ratios of 99 mature Cannabis plants. Log10 frequency distributions of Fdicyclic: Ftricyclic chemotypic values show three discrete distributions, while Log10 frequency distributions of FC3: FC5 chemotypic values have no obvious distribution pattern; C5-alkyl cannabinoid fractions (FC5); C3-alkyl cannabinoid fractions (FC3); dicyclic cannabinoid fractions (Fdicyclic); and tricyclic cannabinoid fractions (Ftricyclic).
