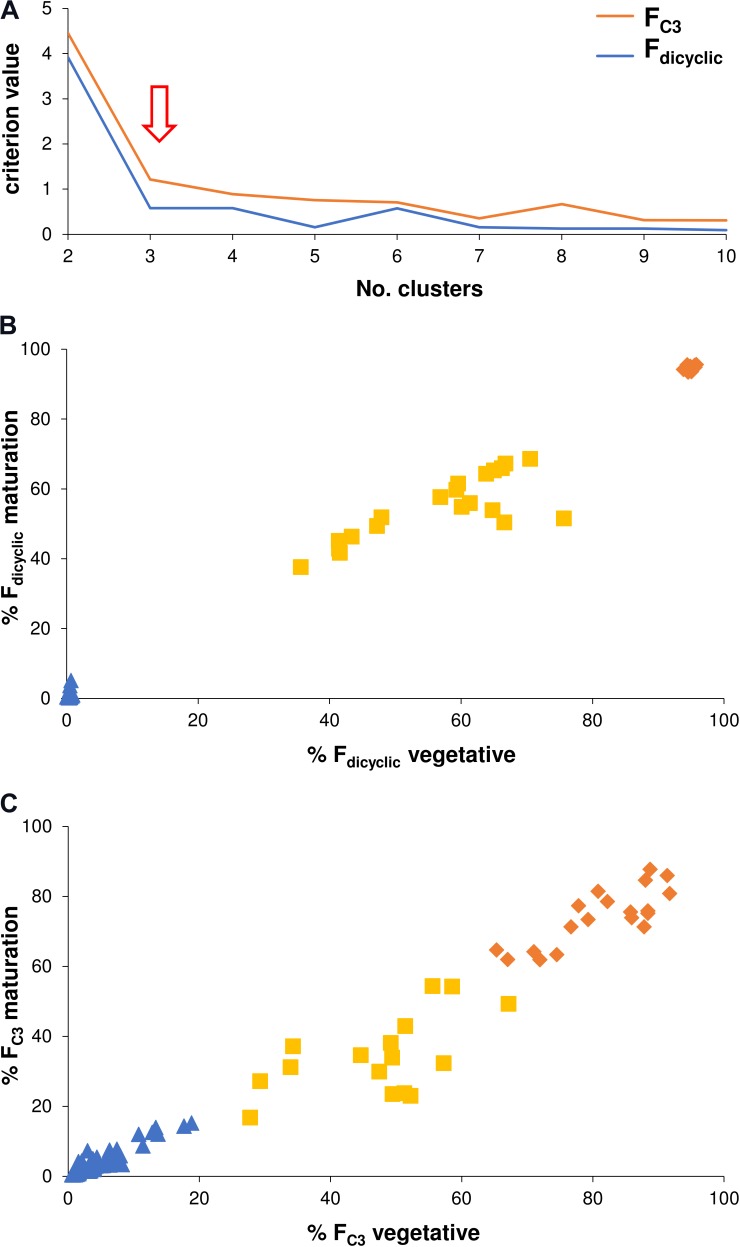
FIGURE 5.
(A) Non-hierarchical k-means cluster analysis criterion values as a function of clusters. (B) Non-hierarchical k-means tripartite cluster analysis for the Fdicyclic chemotypic values across vegetative and maturation developmental stages. (C) Non-hierarchical k-means tripartite cluster analysis for the FC3 values across vegetative and maturation developmental stages. Red arrow indicates optimal number of clusters for the Fdicyclic as well as the FC3 chemotypic values; Blue triangle indicates low cannabinoid fraction cluster; Yellow square indicates intermediate cannabinoid fraction cluster; Orange diamond indicates high cannabinoid fraction cluster; C3-alkyl cannabinoid fractions (FC3); C5-alkyl cannabinoid fractions (FC5); and dicyclic cannabinoid fractions (Fdicyclic).

