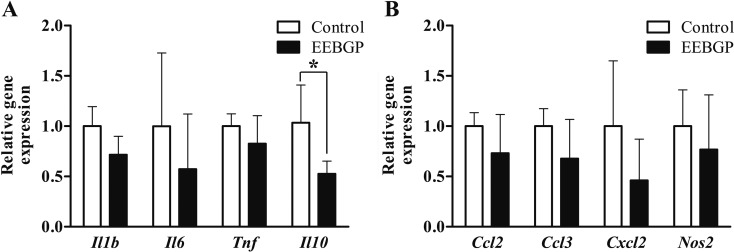
Fig. 3.
mRNA levels of the inflammation-related genes in the liver of the control and EEBGP groups. A: Cytokines. B: chemokines and nitric oxide synthase 2. The mRNA levels are normalized to that of Gapdh expression. The vertical bars represent the mean values and standard deviation for each group. *p<0.05 versus the control group, assessed by Student’s t-test. EEBGP, ethanol extract of Brazilian green propolis

