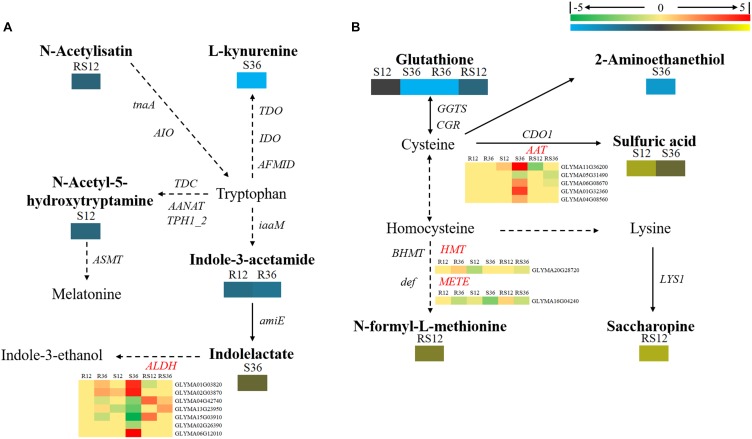
FIGURE 5.
Brief diagram of amino acid metabolism pathways with related DEGs and DAMs. (A) Pathway of tryptophan metabolism. (B) Pathways of cysteine and lysine metabolism. DAMs are in bold black fonts. No significantly differentially accumulated metabolites are in black fonts, unidentified metabolites are in gray fonts, and the abbreviations of gene names are in italics. The log2Foldchange was colored using Cluster 3.0 (red for upregulated DEGs, green for downregulated DEGs, yellow for upregulated DAMs, and blue for downregulated DAMs), and the vertical columns represent R12, R36, S12, S36, RS12 and RS36, from left to right. R12: R-12h-IN vs. R-12h-CK; R36: R-36h-IN vs. R-36h-CK; S12: S-12h-IN vs. S-12h-CK; S36: S-36h-IN vs. S-36h-CK; RS12: R-12h-CK vs. S-12h-CK; and RS36: R-36h-CK vs. S-36h-CK. IN, inoculated; CK, control check. A color bar is in the upper right corner.

