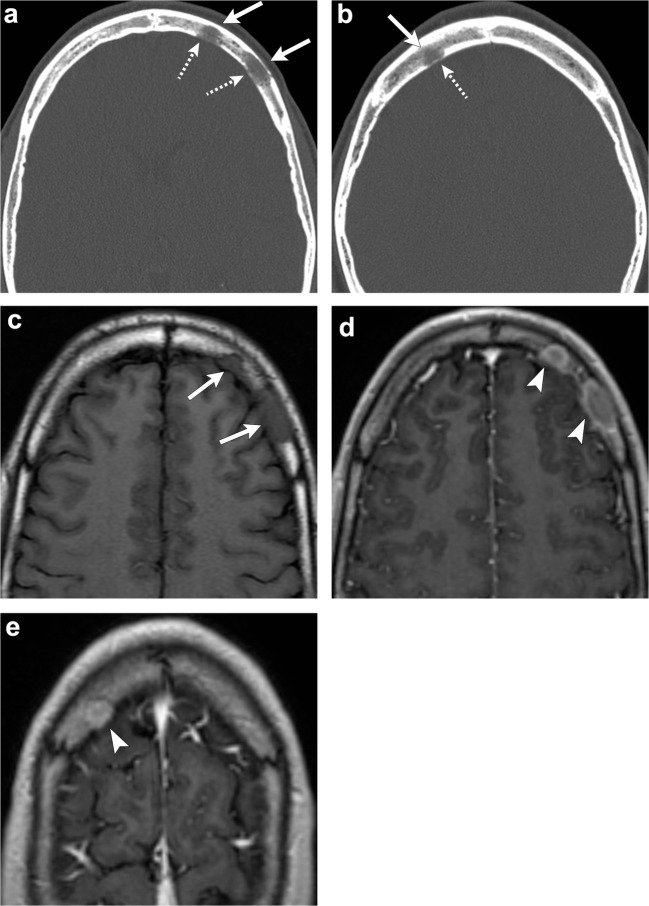
Fig. 11.
Calvaria sarcoidosis. Axial head CT (a, b) images show three lytic lesions in the diploic space of the frontal bones (arrows) with involvement and thinning of the cortex of the inner tables (dashed arrows). Axial T1-weighted imaging (c) depicts hypointense lesions (arrows). Post-contrast T1-weighted (d, e) images demonstrate enhancement of these lesions (arrowheads)

