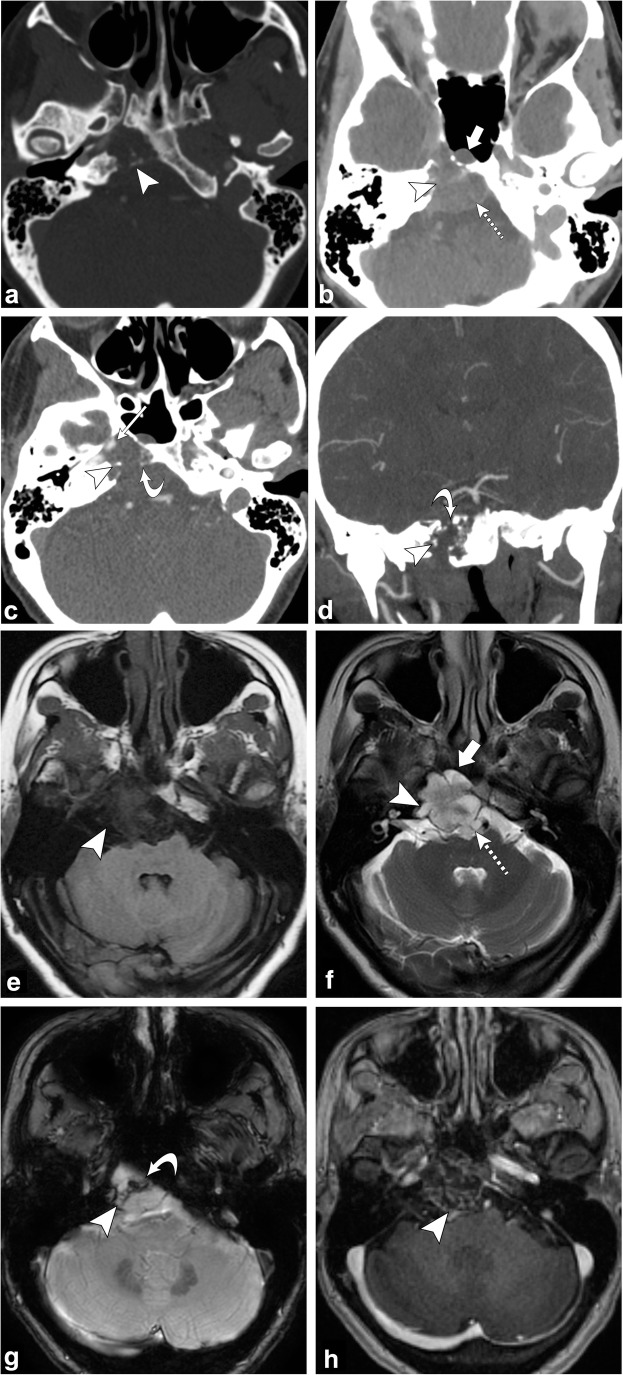
Fig. 20.
Chondrosarcoma. Axial non-contrast CT (a) shows an osteolytic destructive lesion involving the right petro-occipital junction and clivus (arrowhead). Axial contrast-enhanced CT (b) demonstrates this lesion to have a soft-tissue component extending anteriorly into the sphenoid sinus (thick arrow) and posteriorly into the prepontine cistern with mass effect on the pons (dashed arrow). Axial (c) and coronal (d) CT angiogram images demonstrate involvement of the right petrous carotid canal (arrowheads) with the lesion surrounding the right internal carotid artery (thin arrow). Note the punctate calcifications (chondroid matrix) within the mass (curved arrow). Axial T1-weighted (e) and axial T2-weighted (f) images show a lobulated lesion involving the right petro-occipital junction and clivus (arrowhead). Note the extension of the lesion anteriorly into the sphenoid sinus (thick arrow) and posteriorly into the prepontine cistern with mass effect on the pons (dashed arrow). Axial SWAN (g) shows internal foci of low signal, consistent with calcifications (curved arrow). Post-contrast axial T1-weighted imaging (h) demonstrates heterogeneous (“whorls” of) enhancement (arrowhead)

