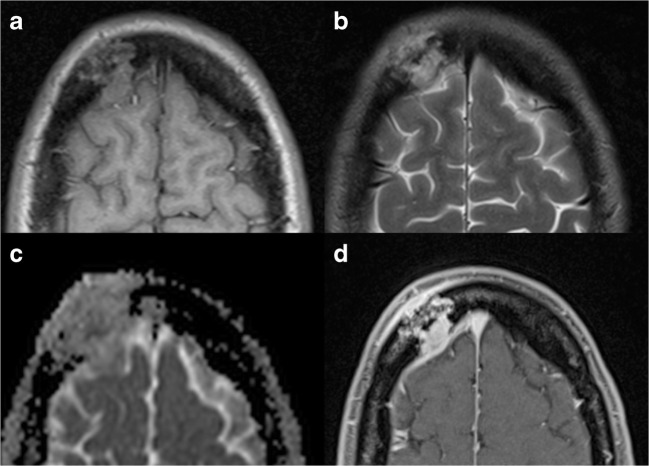
Fig. 10.
EG, same patient shown in Fig. 9. On T1w (a) and T2w (b) images, the lesion appears mildly inhomogeneous, with diffusion restriction on the ADC map (c). MRI allows for an accurate evaluation of the surrounding soft tissues, as well as intracranial extension after contrast administration (d), causing a moderate dural thickening

