
Fig. 2.
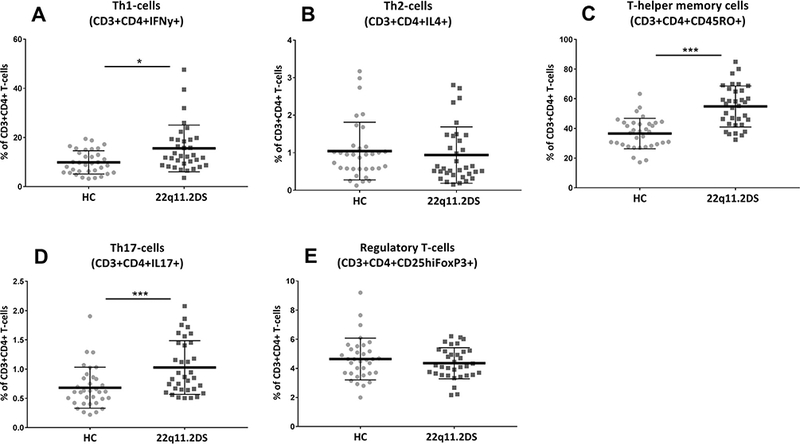
T-helper cell subset percentages in healthy controls versus adults with 22q11.2DS. All populations are derived from staining B and are expressed as a % of total T-helper cell. *** < 0.0001 (Bonferroni corrected); * < 0.05.
Official websites use .gov
A
.gov website belongs to an official
government organization in the United States.
Secure .gov websites use HTTPS
A lock (
) or https:// means you've safely
connected to the .gov website. Share sensitive
information only on official, secure websites.
T-helper cell subset percentages in healthy controls versus adults with 22q11.2DS. All populations are derived from staining B and are expressed as a % of total T-helper cell. *** < 0.0001 (Bonferroni corrected); * < 0.05.