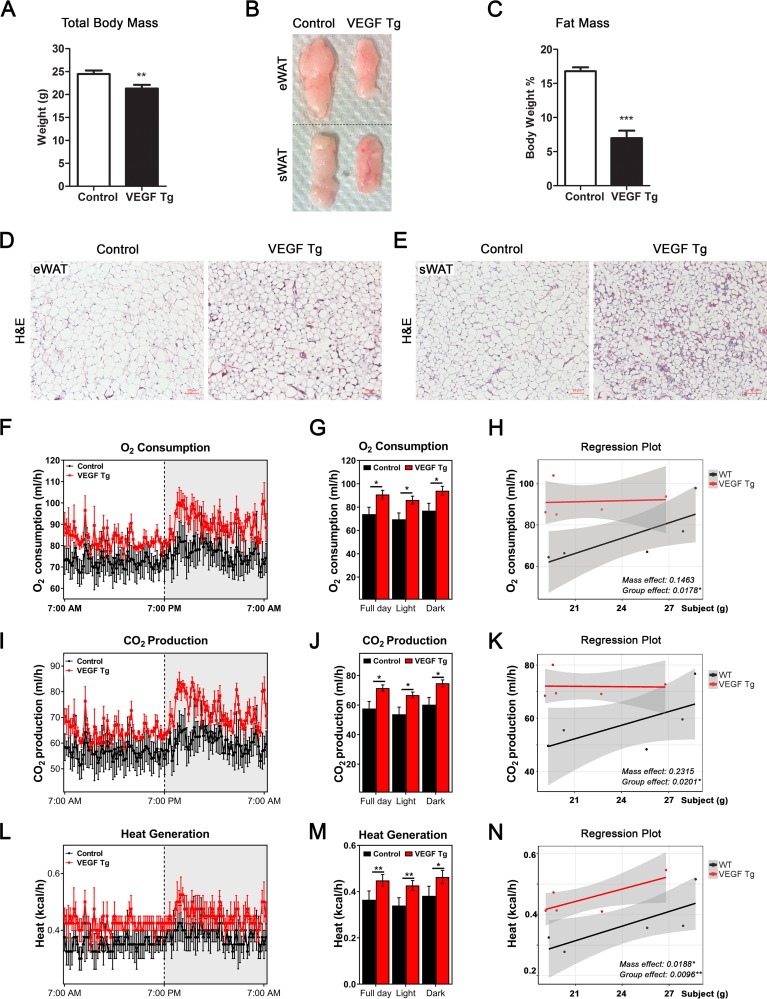
FIG 1.
VEGF-A transgenic mice exhibit smaller adipocytes and reduced total fat mass shortly after VEGF-A induction. (A) Body weights of VEGF Tg mice and their littermate controls after feeding with an HFD (60% fat) plus 30 mg/kg Dox for 7 days (n = 6 per group; Student's t test, **, P < 0.01). (B) Comparison of the sizes of different adipose tissues (eWAT and sWAT) collected from VEGF Tg mice and their littermate controls after HFD-Dox feeding for 7 days. (C) MRI analysis of fat mass in VEGF Tg mice and their littermate controls after HFD-Dox feeding for 7 days (n = 6 per group; Student's t test, ***, P < 0.001). (D and E) H&E staining of eWAT and sWAT collected from VEGF Tg mice and their littermate controls after HFD-Dox feeding for 7 days (scale bar, 50 μm). (F to N) Indirect calorimetry performed in a CLAMS system after HFD-Dox feeding for 7 days. (F) O2 consumption profile of VEGF Tg and control mice during a 12-h light-dark cycle. (G) Histogram representative of full-day and light and dark periods of the results shown in panel F. (H) General linear model-based regression plot of the association between O2 consumption and mass (grams) as well as the association between O2 consumption and the group factor. (I) CO2 production profile of VEGF Tg and control mice during a 12-h light-dark cycle. (J) Histogram representative of full day and light and dark periods of the results shown in panel I. (K) General linear model-based regression plot of the association between CO2 production and mass as well as the association between CO2 production and the group factor. (L) Heat generation profile of VEGF Tg and control mice during a 12-h light-dark cycle. (M) Histogram representative of full day and light and dark periods of the results shown in panel L. (N) General linear model-based regression plot of the association between heat generation and mass as well as the association between heat generation and the group factor. (n = 5 per group; ANCOVA test, *, P < 0.05; **, P < 0.01).

