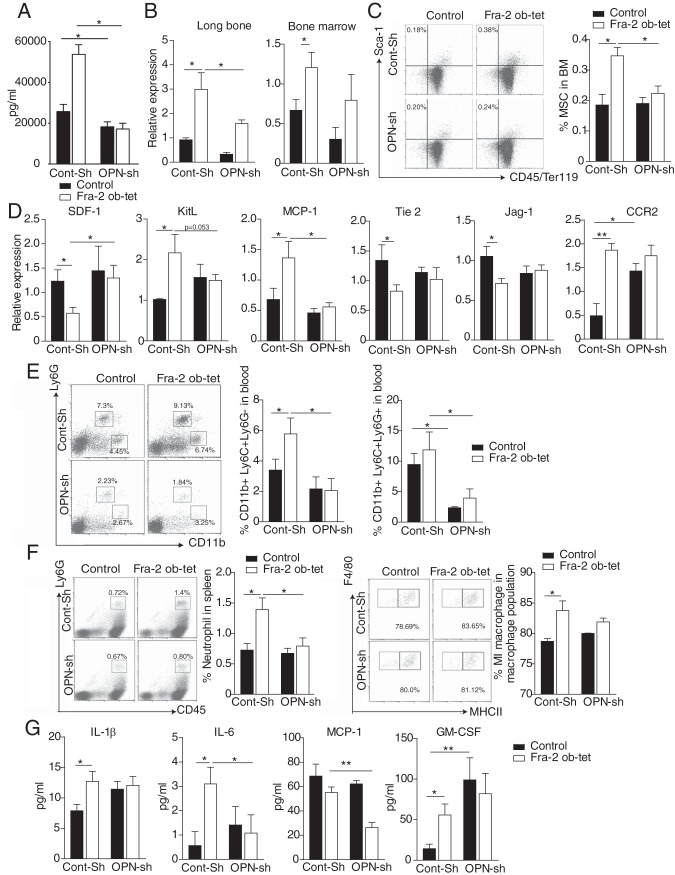
FIG 6.
Osteopontin depletion in Fra-2Ob-tet mice rescues their bone niche and their systemic inflammation phenotypes. (A) OPN levels in sera of Fra-2Ob-tet and littermate mice injected with control (Cont-Sh) or OPN (OPN-Sh) shRNA by hydrodynamic injection (n = 6). (B) Quantitative PCR analyses of OPN in long bones (without bone marrow) and bone marrow of Fra-2Ob-tet and littermate mice injected with control (Cont-Sh) or OPN (OPN-Sh) shRNA by hydrodynamic injection (n = 6). (C) FACS dot plots and quantification of mesenchymal stem cells (Ter119− CD45− Sca-1+) in Fra-2Ob-tet and littermate mice injected with control (Cont-Sh) or OPN (OPN-Sh) shRNA (n = 6). (D) Quantitative PCR analyses of bone niche markers in flushed bone marrow from Fra-2Ob-tet and littermate mice injected with control (Cont-Sh) or OPN (OPN-Sh) shRNA (n = 6). (E) FACS dot plots and quantification of inflammatory monocytes (CD11b+ Ly6C+ Ly6G−) or granulocytes (CD11b+ Ly6C+ Ly6G+) in blood from Fra-2Ob-tet and littermate mice injected with control (Cont-Sh) or OPN (OPN-Sh) shRNA (n = 6). (F) FACS dot plots and quantification of neutrophils and proinflammatory (MI-like) macrophages in spleens from Fra-2Ob-tet and littermate mice injected with control (Cont-Sh) or OPN (OPN-Sh) shRNA (n = 6). (G) Inflammatory cytokine and chemokine levels in sera from Fra-2Ob-tet and littermate control mice injected with control (Cont-Sh) or OPN (OPN-Sh) shRNA (n = 6). Data represent the mean values ± SEM. *, P < 0.05; **, P < 0.01 (by ANOVA).

