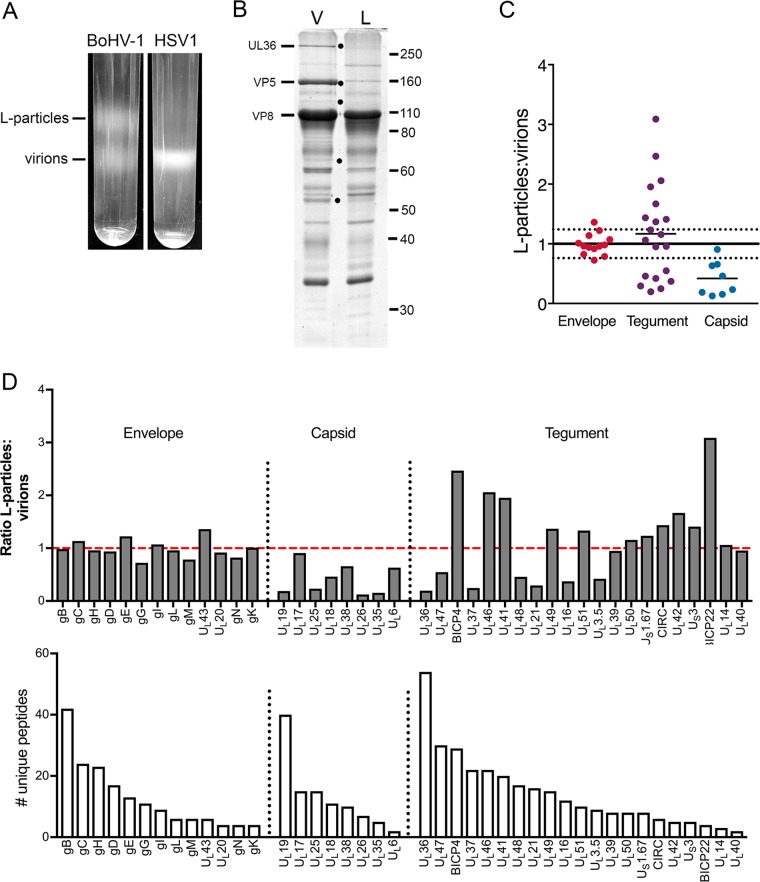
FIG 5.
Quantitative proteomic comparison of the L-particles and virions produced during BoHV-1 infection. (A) Confluent monolayers of MDBK cells were infected with BoHV-1 strain P8-2, and HaCaT cells were infected with HSV-1 strain Sc16, both at a multiplicity of 0.02. At full cytopathic effect, the extracellular medium was harvested, and released particles were isolated on 5% to 15% Ficoll gradients. Representative Ficoll gradients of BoHV-1 and HSV-1 particle preparations isolated at the same time are shown. (B) Equal amounts of the virion (V) and L-particle (L) bands of BoHV-1 were separated by 10% SDS-PAGE and stained with Coomassie blue. Black dots denote protein bands present in virions but not L-particles. Size markers are shown in kilodaltons. (C) The BoHV-1 virion and L-particle samples were subjected to TMT labeling and analyzed by mass spectrometry. Shown is a summary of the normalized ratios of virus proteins detected in BoHV-1 L-particles to virions, grouped according to their predicted location within the virion. The normalization line represents the average of all glycoprotein ratios, with 1 standard deviation on either side represented by dotted lines. (D) Ratio of individual virus proteins in BoHV-1 L-particles compared to virions (top), in order of the number of unique peptides detected (bottom). The dashed red line is the glycoprotein normalization line.

