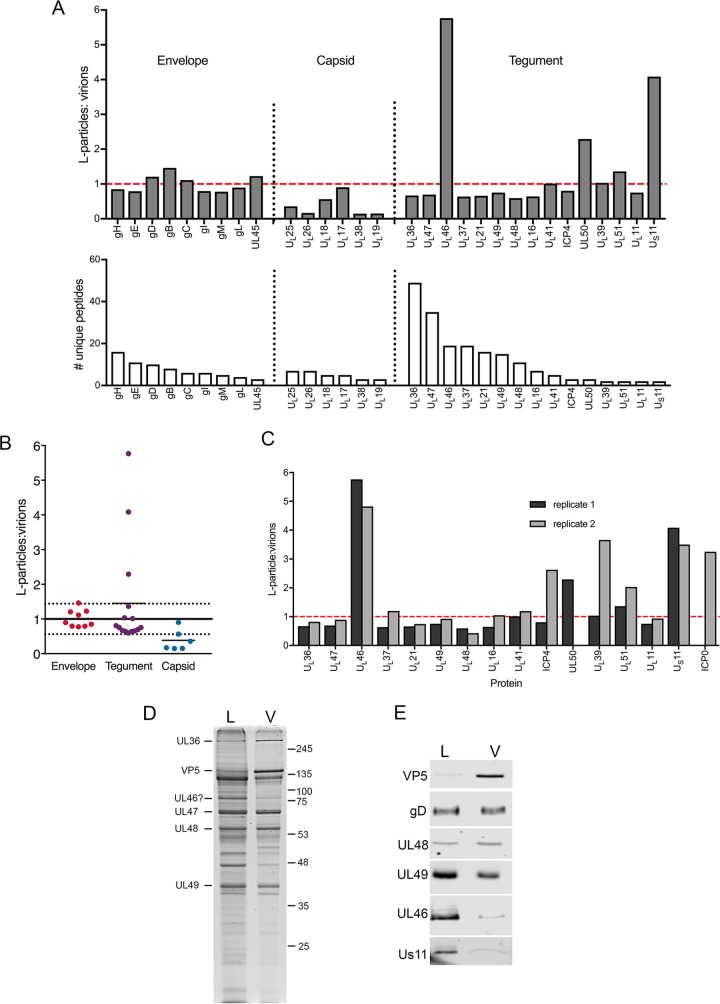
FIG 6.
Quantitative proteomic comparison of the L-particles and virions produced in HSV-1 infection. (A) A Ficoll gradient for HSV-1 strain Sc16 similar to that shown in Fig. 5A was harvested for virions and L-particles as for BoHV-1 and analyzed by tandem mass tag labeling mass spectrometry as for BoHV-1. The results are presented as the ratio of the number of individual virus proteins in HSV-1 L-particles to virions (top), in order of the number of unique peptides detected (bottom). The dashed red line is the glycoprotein normalization line. (B) Summary of the normalized ratios of virus proteins detected in HSV-1 L-particles to virions, grouped according to their predicted location within the virion. The normalization line represents the average of all glycoprotein ratios, with 1 standard deviation on either side represented by dotted lines. (C) Comparative ratios of individual tegument proteins between two independent TMT labeling analyses. (D and E) Approximately equivalent amounts of Sc16 virions (V) and L-particles (L) were subjected to SDS-PAGE on a 10% polyacrylamide gel followed by Coomassie blue staining (D) or Western blotting (E) for the indicated virus proteins. Approximately equivalent numbers of particles were loaded by equating gD and UL48 by Western blotting. Molecular weight markers are shown in kilodaltons.

