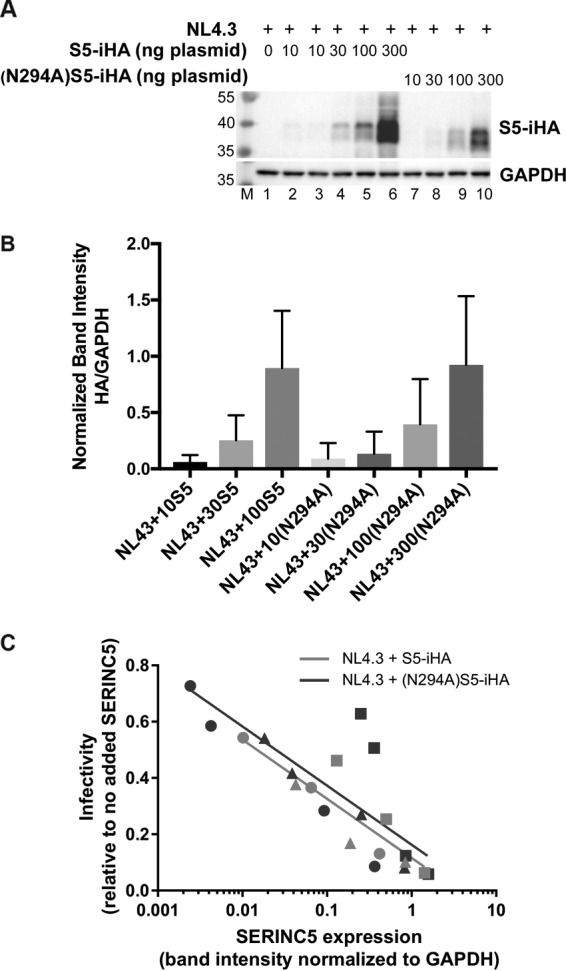
FIG 5.

Extended dose-response experiment evaluating the sensitivity to Nef of nonglycosylated (N294A)S5-iHA as a function of protein expression. Zero, 10, 30, 100, or 300 ng of pBJ5-S5-iHA or pBJ5-(N294A)S5-iHA was used to transfect HEK293 cells together with 1.2 μg of pNL43 or pNL43ΔNef proviral plasmids. Twenty-four hours after transfection, the cells and virions were isolated for immunoblotting and measurement of infectivity. (A) Immunoblot showing the expression of wild-type S5-iHA and (N294A)S5-iHA after transfection of cells with the indicated amounts of plasmids. (B) The expression of S5-iHA, (N294A)S5-iHA, and GAPDH was quantified using Image Lab software (Bio-Rad). The band intensities for HA in the immunoblots were normalized to GAPDH and plotted using GraphPad Prism 7.0 software. The 300 ng pBJ5-S5-iHA condition was excluded due to image saturation. The bar graph represents data from three independent experiments; error bars are the standard deviations. (C) Viral infectivity (infectious centers/p24 relative to the no-SERINC5 control) was measured as described in the legend of Fig. 4A but is graphed versus the GAPDH-normalized band intensity for SERINC 5-HA. Data are from three independent experiments (shown using different symbols: circle, square, or triangle); within each experiment, each datum point was derived from duplicate measurements of infectious centers and p24 concentration and a single measurement of SERIN5-iHA band intensity. Data for the 300 ng wild-type S5-iHA were excluded due to image saturation. Best-fit trend lines are shown for NL43 with either wild-type S5-iHA (pink line) or (N294A)S5-iHA (blue line). Trend lines were generated using nonlinear regression analysis with the least-squares method fitting to semilog lines. The slopes of the two lines were compared using the extra sum-of-squares F test (GraphPad Prism 7.0) and were not significantly different (P = 0.82).
