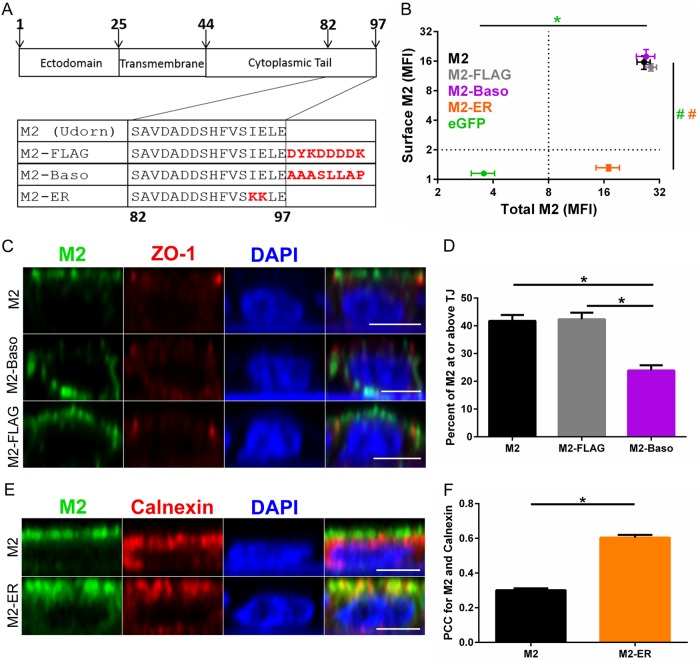
FIG 1.
Localization of M2 proteins. (A) Schematic of Udorn M2 proteins with mutations made to the cytoplasmic tail to alter intracellular membrane targeting. (B) Surface and total M2 staining of MDCK II cells stably expressing the indicated protein. Error bars indicate standard errors of the means (SEM). P values were <0.01 (*) (total) and <0.01 (#) (surface) for M2 compared to WT M2 (ANOVA with Bonferroni multiple-comparison posttest). The color of the significance indicator matches the image legend. n = 4 to 7 stably transfected cell lines. (C and E) Immunofluorescent confocal microscopy images of MDCK II cells stably expressing the indicated M2 construct and immunostained for the indicated proteins. Scale bar, 5 μm. (D) Quantification of apical targeting by percentage of M2 staining at or above the tight junctions (TJ). n = 40 total cells from 2 to 3 stably transfected cell lines. *, P < 0.01 (ANOVA with Bonferroni multiple comparison posttest). (F) Quantification of M2 and calnexin colocalization (Pearson's correlation coefficient). n = 100 total cells from 2 to 3 stably transfected cell lines. *, P < 0.01 (unpaired t test).

