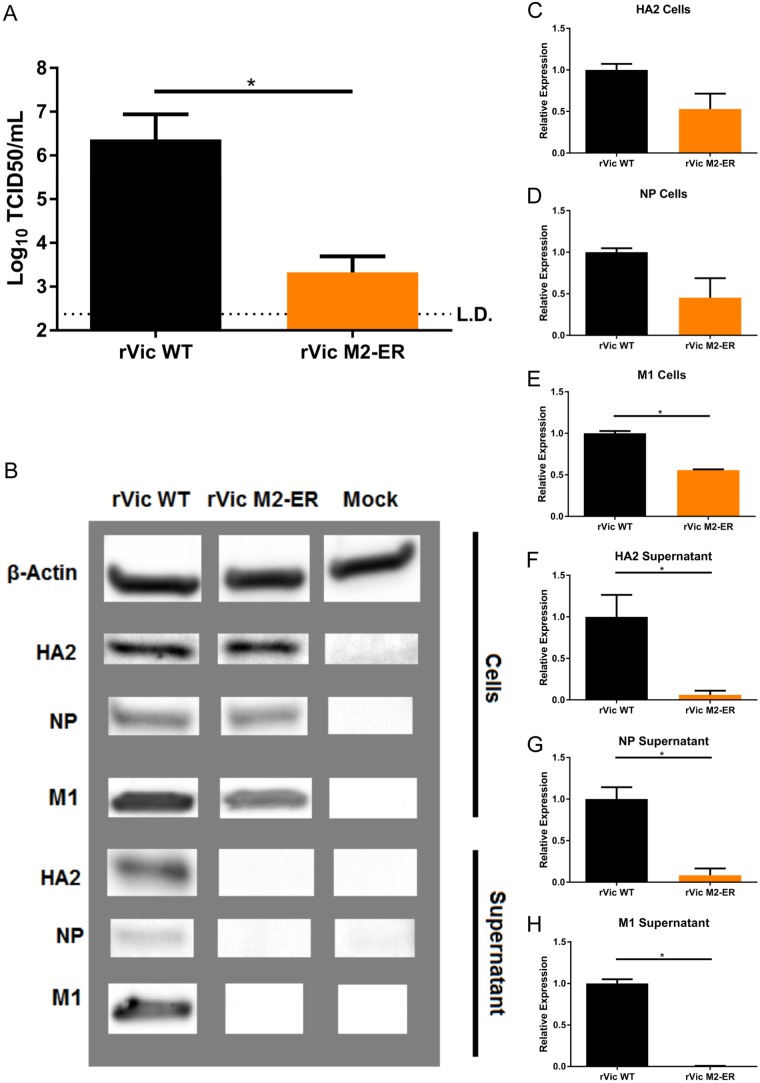
FIG 7.
Replication and protein expression of rVic M2-ER on MDCK cells. High-MOI infections were performed with the indicated viruses for 15 to 24 h. (A) Virus titer at endpoint. Data are representative of three independent experiments. n = 3 wells per experiment. *, P < 0.01 (unpaired t test). (B) Infected cell supernatants and cells were lysed and analyzed by Western blotting with antibodies against HA2, NP, and M1. (C to H) HA2 quantification for cells (C) and supernatant (F), NP quantification for cells (D) and supernatant (G), and M1 quantification for cells (E) and supernatant (H). Two or three independent replicates were performed in triplicate, and average data from each replicate were used. *, P < 0.01 (unpaired t test).

