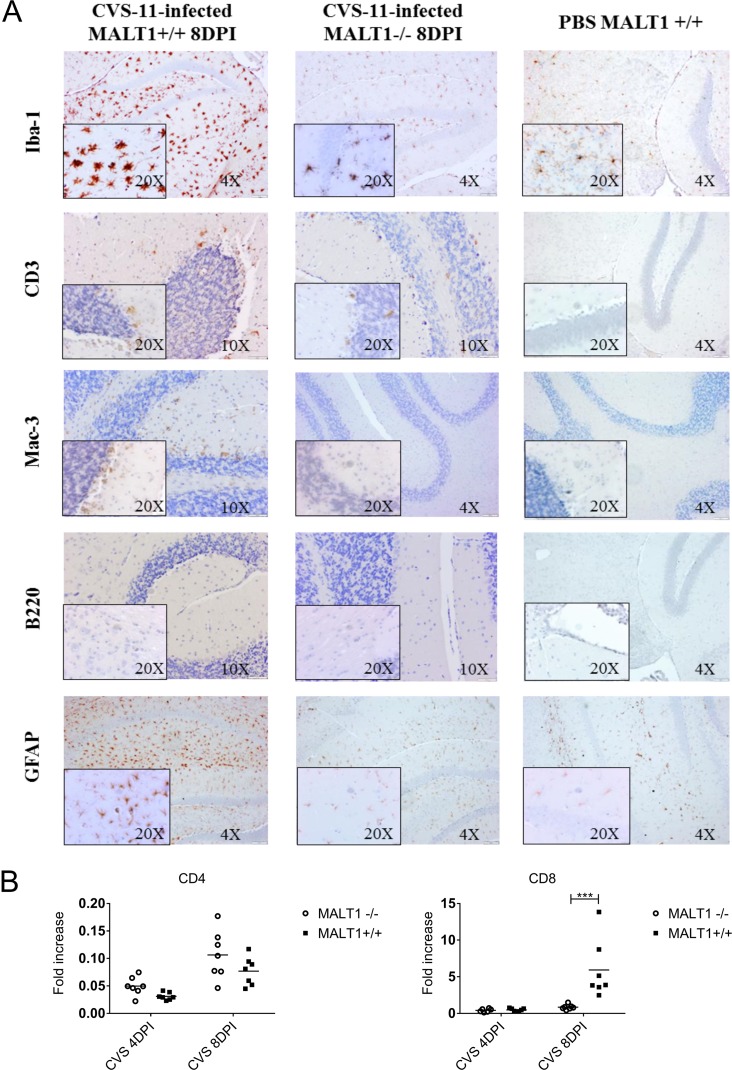
FIG 4.
Reduced infiltration and activation of inflammatory cells in the brain of Malt1−/− mice at 8 dpi with CVS-11 virus. (A) Immunohistochemical analysis of CNS sections from infected Malt1+/+ and Malt1−/− mice at 8 dpi. PBS-inoculated mice were used as controls. Sections of cerebellum and hippocampus are shown. Brain sections were immunostained for Iba1 (microglial cells), CD3 (T cells), Mac-3 (macrophages), B220 (B cells), and GFAP (astrocytes). PBS-injected Malt1+/+ C57BL/6 mice showed abundant inactive ramified microglial cells and astrocytes, but no B cell, macrophage, or T cell infiltration. At 8 dpi, infected MALT1+/+ mice showed activation of microglial and astroglial cells and infiltration of T lymphocytes and macrophages in the parenchyma but no B cell infiltration. In Malt1−/− mice, T lymphocyte and macrophage infiltration, as well as microglial/astrocyte activation, were reduced. Bars, 100 μm (magnification, ×4), 50 μm (magnification, ×10), or 20 μm (magnification, ×20). Data are representative of 2 mice per condition. (B) Quantitative RT-qPCR measurements of the indicated mRNA expression levels in brains of Malt1+/+ (n = 7) and Malt1−/− (n = 7) littermate mice are shown. Results are represented as fold increases compared to respectively noninfected Malt1+/+ and Malt1−/− littermate mice. The asterisks indicate significant differences between infected Malt1−/− mice and CVS virus-infected Malt1+/+ mice at the same time points (4 dpi or 8 dpi) determined by two-way ANOVA and Sidak's multiple-comparison test. Statistical differences are denoted as follows: ****, P < 0.0001; ***, P < 0.001; **, P < 0.01; *, P < 0.05.

