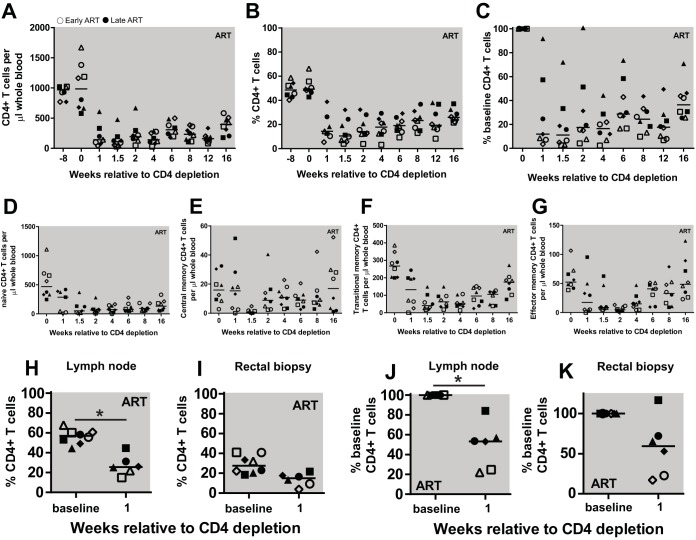
FIG 2.
Dynamics of CD4+ T cell depletion and reconstitution. (A to C) CD4+ T cells expressed as counts (cells/μl whole blood) (A), frequency in PBMC (B), and a percentage of baseline CD4 counts (C). (D to G) CD4+ T cell memory subsets were measured during CD4 depletion and reconstitution, including naive (D), central memory (E), transitional memory (F), and effector memory T cells (G). (H to K) Tissue measures of CD4+ T cells. The frequency of CD4+ T cells in lymph nodes (H) and rectal biopsy specimens (I). The percentage of CD4+ T cells as a percentage of baseline in lymph nodes (J) and rectal biopsy specimens (K). Open symbols represent early chronic treated animals, and closed symbols represent late chronic treated animals. Each symbol represents a different animal, and the line represents the median. Statistical differences were determined using Wilcoxon rank sum test (*, P < 0.05).

