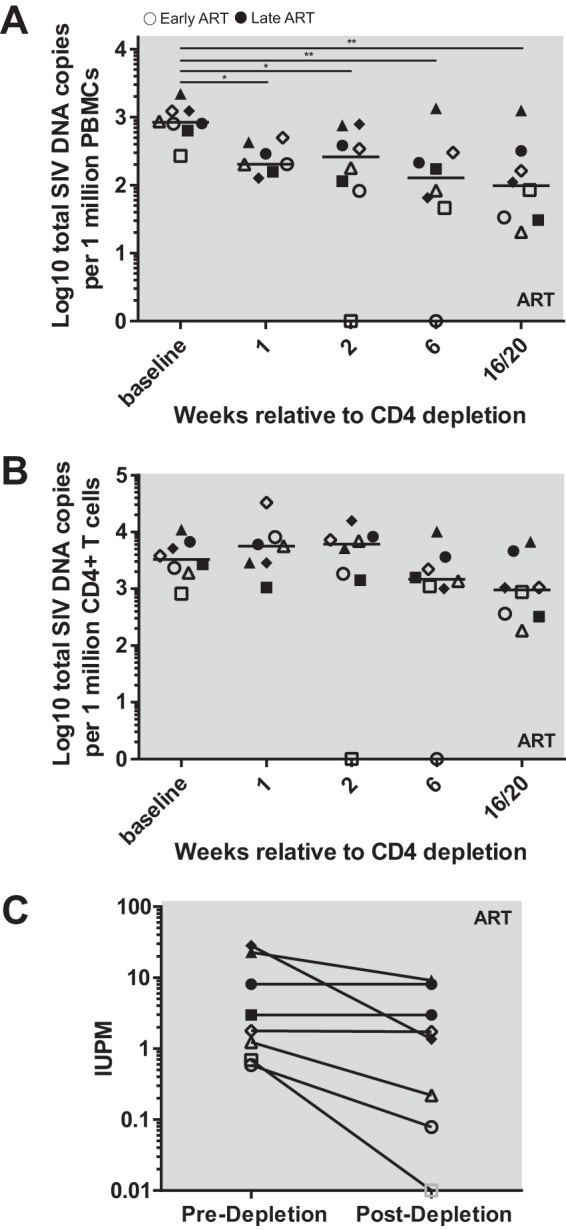
FIG 5.

SIV reservoir dynamics after CD4 depletion. Total cell-associated SIV DNA was measured in PBMC (A) and calculated in CD4+ T cells (B). (C) Quantitative SIV outgrowth assay. Open symbols represent early chronic treated animals, and closed symbols represent late chronic treated animals. Each symbol represents a different animal. Gray outlined animals were undetectable, the solid line represents the median, and horizontal dotted lines represent the limit of detection (60 or 3 copies/ml of plasma). Statistical differences were determined using the Friedman test (*, P < 0.05; **, P < 0.01).
