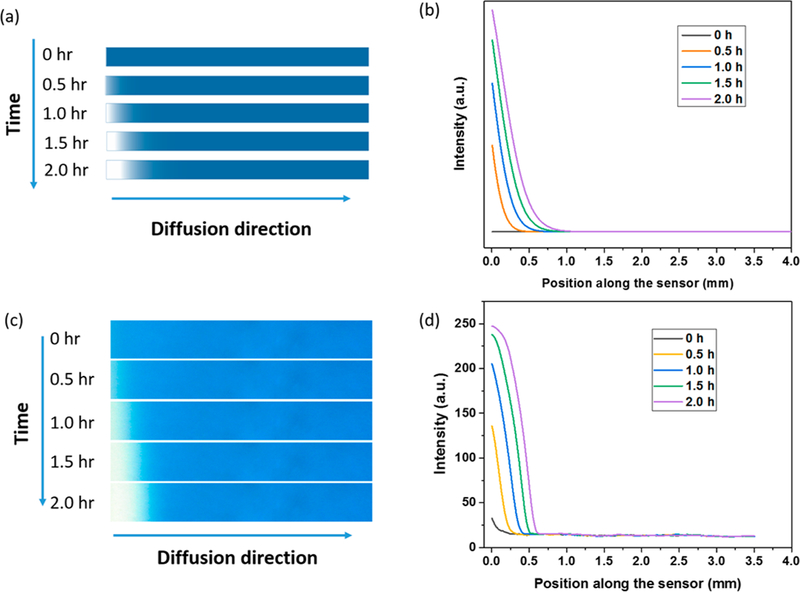
Figure 2.

Simulated (top) and measured (bottom) gradient shifts upon continuous exposure to O3 over 2 h. (a) Simulated concentration profiles of unreacted O3 sensing probe (indigo carmine, blue color) when exposed to 500 ppbV O3 for 0, 0.5, 1, 1.5, and 2 h, respectively. (b) Simulated intensity profile (color gradient) along the sensor (colored solid lines). (c) Measured images with the CMOS imager showing color gradient development over 2 h at 500 ppb O3. (d) Measured intensity profile (color gradient) shifts along the sensor surface over time.
