
Extended Data Figure 6. AP administration does not precociously eliminate non-senescent glial cells isolated from ATTAC mice.
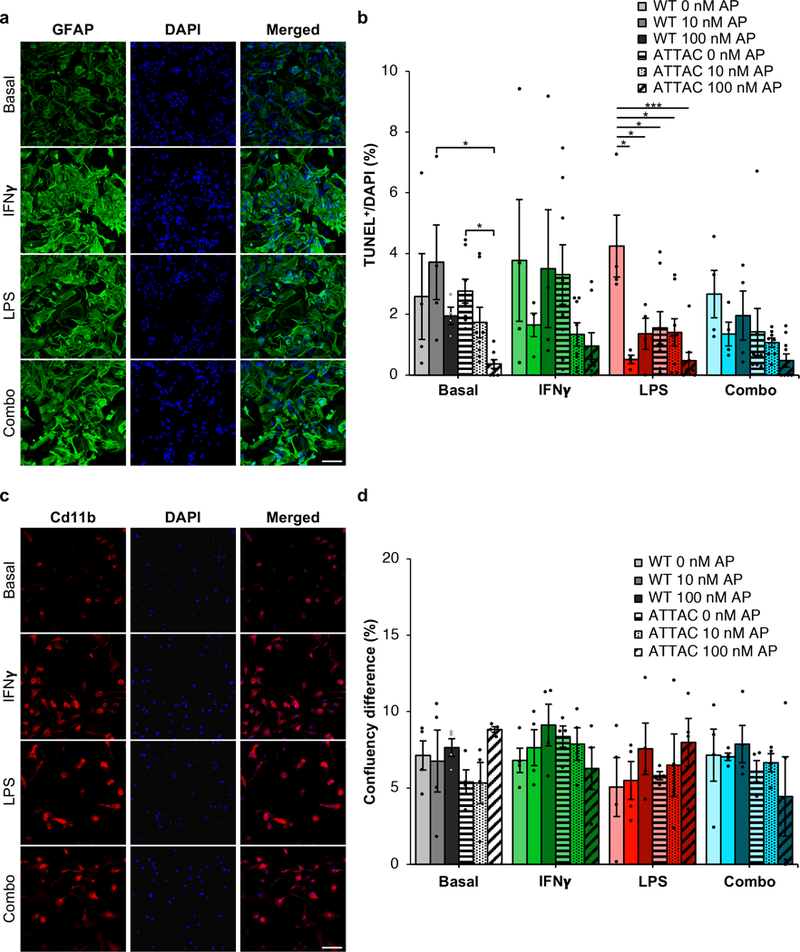
a, Cd11b staining of primary microglia treated with IFNγ (200 ng/ml), LPS (100 ng/ml), or a combination of both (n = 3 biologically independent samples). b, Quantification of TUNEL positive bodies in basal or activated microglia (n = 4 WT and 8 ATTAC cultures for each treatment group, 2 independent experiments). c, GFAP staining of primary astrocytes treated with IFNγ, LPS, or a combination of both as described in (a) (n = 3 biologically independent samples). d, Quantification of confluency change over 24 hours in basal or activated astrocytes (n = 4 biologically independent cultures of each genotype and treatment). Scale Bars, 100 μm (a and c). Data are mean ± s.e.m. *P < 0.05; ***P < 0.001 (one-way ANOVA with Tukey’s multiple comparisons test (b and d)). Exact P values can be found in the accompanying source data file.