
Figure 2. Senescent cells promote insoluble tau aggregates.
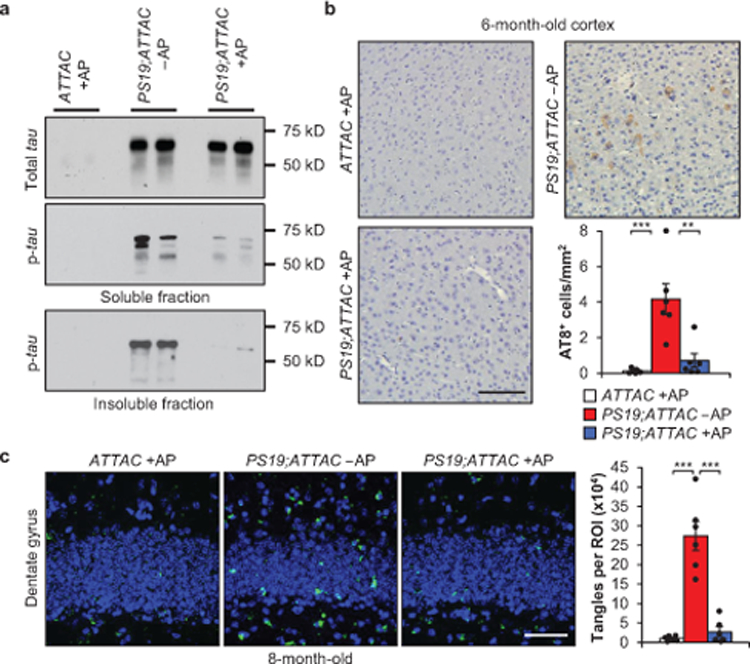
a, Representative western blot (≥ 3 independent experiments) analysis of 6-month-old whole brain for soluble tau (top), soluble phosphorylated tau (S202/T205; middle), and insoluble phosphorylated tau (S202/T205; bottom). b, Immunostaining and quantification of cortex sections for phosphorylated tau (S202/T205) protein aggregates (n = 6 mice per group, 3 independent experiments). c, Thioflavin S staining and quantification for neurofibrillary tangles located within the dentate gyrus (n = 6 mice per group, 2 independent experiments; normalized to ATTAC +AP group). Key is as indicated in b. Scale bars, 100 μm (b) and 50 μm (c). Data are mean ± s.e.m. **P < 0.01; ***P < 0.001 (one-way ANOVA with Tukey’s multiple comparisons test). Exact P values can be found in the accompanying source data file. For gel source data, see Supplementary Figure 1.