
Figure 3. Senescent cells drive neurodegenerative disease.
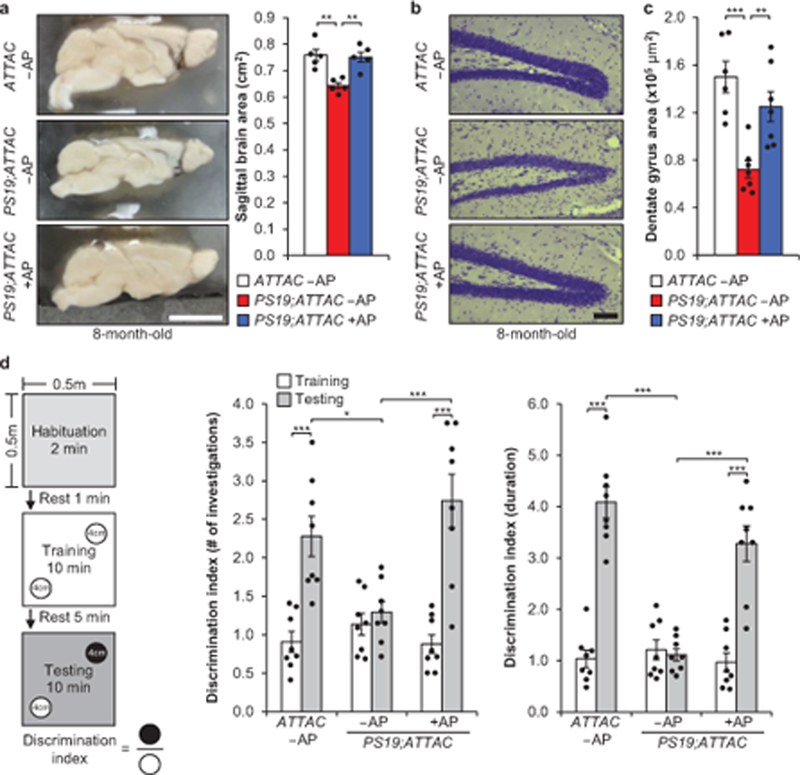
a, Sagittal midline brain area of 8-month-old mice (n = 5 males per group, 2 independent experiments). b, Nissl stains of the dentate gyrus from 8-month-old mice. c, Average area of the dentate gyrus (measuring the pyramidal neuron layer) from serial, coronal NeuN-stained free-floating sections (n = 6 ATTAC –AP and n = 7 PS19;ATTAC –AP and PS19;ATTAC +AP mice, 2 independent experiments). d, Novel object recognition experiment setup and average ratio for the number of investigations and duration of those investigations (n = 8 female mice per group). Scale bars, 0.5 cm (a) and 100 μm (b). Data are mean ± s.e.m. *P < 0.05; **P < 0.01; ***P < 0.001 (one-way ANOVA with Tukey’s multiple comparisons test (a and c) and two-way ANOVA with Tukey’s multiple comparisons test (d)). Exact P values can be found in the accompanying source data file.