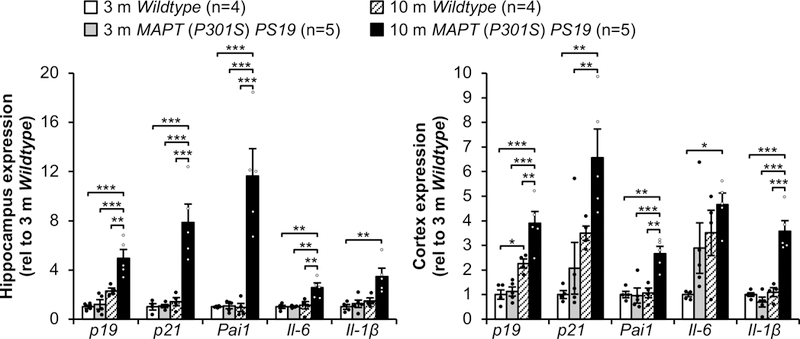
Extended Data Figure 1. Senescent cells accumulate in PS19 mice.

RT-qPCR analysis for senescence-associated genes in hippocampi (left) and cortices (right) of 3- and 10-month-old male mice (animal numbers indicated in the legend, 2 independent experiments; normalized to 3 m Wildtype group). Data are mean ± s.e.m. *P < 0.05; **P < 0.01; ***P < 0.001 (one-way ANOVA with Tukey’s multiple comparisons test). Exact P values can be found in the accompanying source data file.
