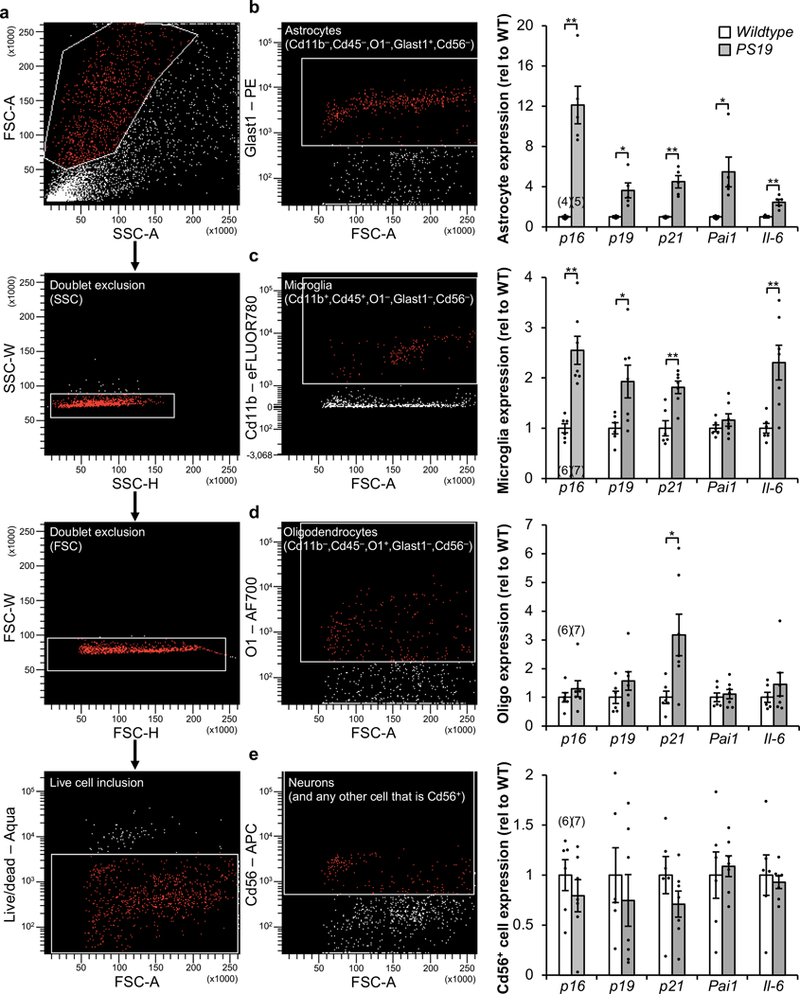
Extended Data Figure 4. Increased senescence-associated gene expression is observed in astrocytes and microglia isolated from PS19 mice.

a–e, Gating strategy (a) for FACS isolation of living astrocytes (b), microglia (c), oligodendrocytes (d), and neuron-enriched Cd56+ cells (e) from cortices from 6-month-old WT and PS19 mice. b, Astrocyte (Cd11b–,Cd45–,O1–,GLAST+,Cd56–) fraction (left) and RT-qPCR analysis (right). c, Microglia (Cd11b+,Cd45+,O1,GLAST+,Cd56–) fraction (left) and RT-qPCR analysis (right). d, Oligodendrocyte (Cd11b–,Cd45–,O1+,GLAST–,Cd56–) fraction (left) and RT-qPCR analysis (right). e, Neuron-enriched Cd56+ (Cd11b–,Cd45–,O1–,GLAST–,Cd56+) fraction (left) and RT-qPCR analysis (right). p21 is also known as Cdkn1a; Pai1 is also known as Serpine1. Individual numbers of independent animal cell population isolations are indicated in the parentheses above p16Ink4a columns (2 independent experiments). Data are mean ± s.e.m. *P < 0.05; **P < 0.01 (unpaired two-sided t-tests with Welch’s correction). Exact P values can be found in the accompanying source data file.
