
Extended Data Figure 5. Cell identity verification of cell populations isolated by FACS.
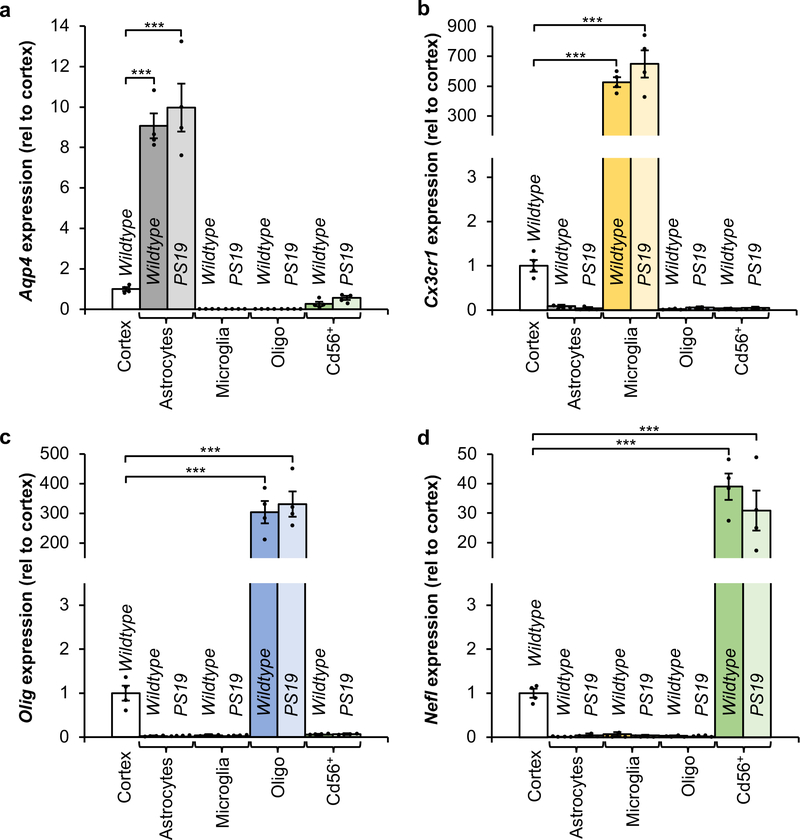
a–d, RT-qPCR analysis for cell identity markers from cell populations isolated from 6-month-old Wildtype and PS19 mice for Aqp4 expression enriched in astrocytes (a), Cx3cr1 expression enriched in microglia (b), Olig expression enriched in oligodendrocytes (c), and Nefl expression enriched in neurons (d). Expression is normalized to intact cortices of 6-month-old Wildtype mice (n = 4 biologically independent cell isolations for each group, 2 independent experiments). Data are mean ± s.e.m. ***P < 0.001 (one-way ANOVA with Tukey’s multiple comparisons test). Exact P values can be found in the accompanying source data file.