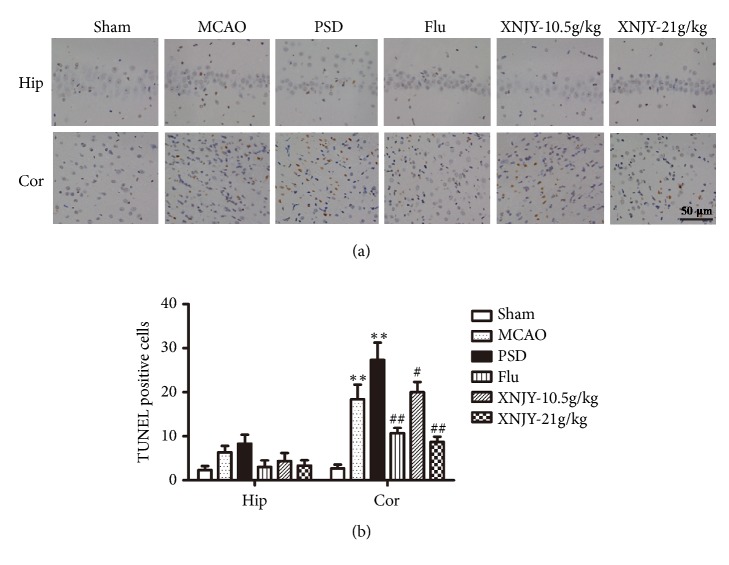
Figure 4.
XNJY protected neurons against PSD-induced apoptosis. Apoptotic neurons in the CA1 region of hippocampus and prefrontal cortex (a). Graph shows the number of TUNEL-positive cells (b). Data were expressed as mean ± SEM. Multiple comparison analysis was conducted by Tukey test after ANOVA. Differences at p < 0.05 were considered statistically significant. ∗∗p < 0.01, versus Sham group; #p < 0.05, ##p < 0.01, versus PSD group.

