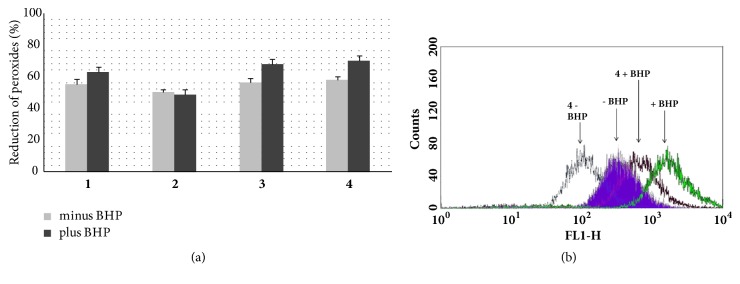
Figure 2.
In-cells antioxidant potential of pinoresinol and the northrachelogenin derivatives. (a) Unstimulated (white bars) and BHP-stimulated (black bars) Jurkat cells were incubated with each tested compounds (50 μM) or vehicle only. Cellular concentrations of peroxides (DCF fluorescence) were measured by cytofluorometry. Data shown were obtained using the mean fluorescence values and are the mean values ± SD of at least three experiments performed in duplicate. P values were always <0.01. (b) Representative histograms obtained with 8α-hydroxypinoresinol (4).

