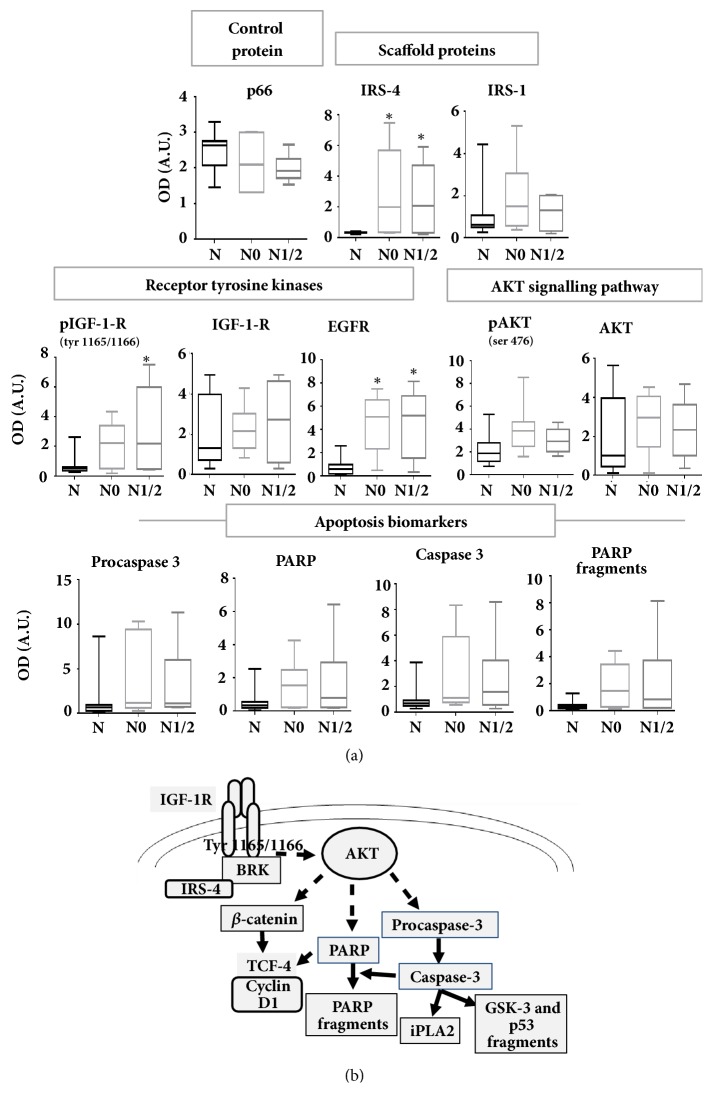
Figure 6.
(a) The 20 patients were stratified into stage N0 (absence of regional lymph node metastasis) or N1/2 (presence of regional lymph node metastasis) of TNM classification and densitometric quantification of western blots from all patients was represented in bar graphs. Results represent the mean ± SD. Levels of significance: ∗ p<0.05; ∗∗p<0.01; ∗∗∗ p<0.001. (b) Schematic model on the role of IRS-4 on CRC. N = MANC tissue. OD = optical density. A.U. = arbitrary units.

