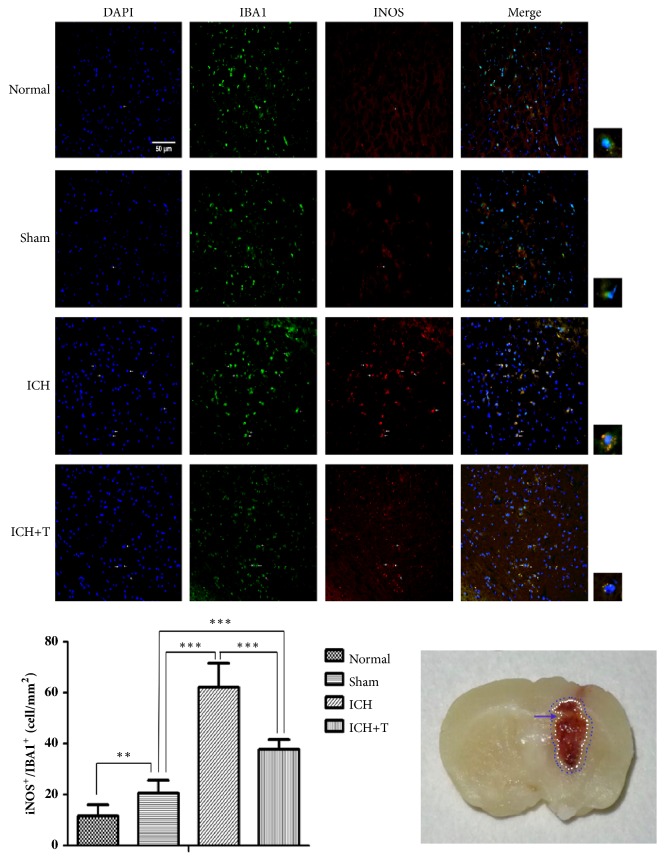
Figure 4.
AC-YVAD-CMK decreased iNOS+/Iba1+ cells. ICH group showed increased iNOS+/Iba1+ cells 1 day after ICH as compared to the sham group. ICH+T, however, showed significantly decreased iNOS+/Iba1+ cells 1 day after ICH group compared with ICH group. Arrows indicate iNOS+/Iba1+ cells (∗∗P < 0.01,∗∗∗P < 0.001, n = 3). ICH+T: treated with AC-YVAD-CMK. ICH: treated with DMSO. The region between the red and blue cycle (blue arrow) indicates the area around hematoma, where images were taken. Scale bar= 50 μm. (The white arrow in immunofluorescence staining picture indicates the stained area; the white square shows the costained cells, which is the enlarged part.) One-way ANOVA.

