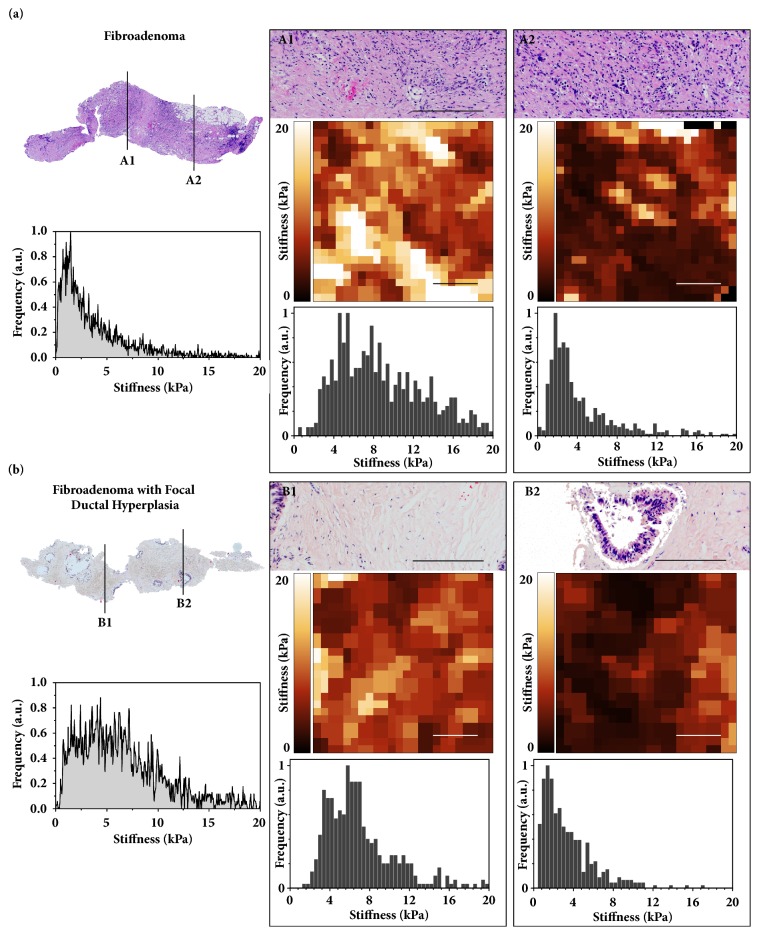
Figure 5.
The nanomechanical signature of benign breast lesions. (a) (left, top) Post-AFM histology of the biopsy revealing a fibroadenoma with reference to the areas A1/A2 mapped in detail. (Left, bottom) Biopsy-wide stiffness distribution shows broad unimodal distribution with a peak value around 2.5 kPa. Local histology analysis (A1/A2 top; scale bar, 200 μm) of mapped regions revealed high abundance of fibroblasts and collagen fibers that could be distinguished in more detail in representative high-resolution AFM stiffness maps (A1/A2 middle; scale bar 6 μm) and by the corresponding stiffness distributions (A1/A2 bottom). (b) (Left, top) Post-AFM histological overview of the biopsy revealing a fibroadenoma with focal ductal hyperplasia with reference to the areas B1/B2 mapped in detail. (Left, bottom) Biopsy-wide stiffness distribution shows broad bimodal stiffness distribution with the peak values around 1.5 kPa and 5 kPa. (B1/B2 top) Local histological analysis shows mostly fibrotic tissue in B1, and in B2 an area presenting a duct with usual ductal hyperplasia surrounded by the interstitial connective tissue (scale bar, 200 μm). The hyperplasia is seen as a softer peak in corresponding high-resolution AFM stiffness maps (B2 middle, right; scale bar 6 μm) and a corresponding stiffness distribution typical for healthy tissue (B2 bottom, right). In the adjacent areas, the presence of connective tissue typical of a fibroadenoma was demonstrated by the increased stiffness visualized in the color-coded stiffness map (B1 middle, left; scale bar 6 μm) and by the corresponding stiffness values around 5 kPa (B1 bottom, left).

