Abstract
Paucity of data from African populations has restricted understanding of the heritable human genome variation. Although under-represented in human genetic studies, Africa has sizeable genetic, cultural and linguistic diversity. The Human Heredity and Health in Africa (H3Africa) initiative is aimed at understanding health problems relevant to African populations, and titling the scales of data deficit and lacking expertise in health-related genomics among African scientists. We emphasise that careful consideration of the sampled populations in the H3Africa projects is required to maximise the prospects of identifying and fine-mapping novel risk variants in indigenous populations. H3Africa which considers national and within-continental cohorts must have well thought out documented protocols that carefully consider human demographic history.
Keywords: Africa, GWAS, Population substructure, H3Africa
Introduction
The 1000 Genomes Project (1000GP) is an invaluable resource that has improved understanding of global human genetic variation and its contribution to disease biology across multiple populations of distinct ethnicity 1. This catalogue of over 88 million high-quality variants from 26 populations has enhanced power to screen for common and rare variants that depict geographic and demographic differentiation 2. This represents 80% (80 million) of all variants contributed or validated in the public dbSNP catalogue, with recent major enhancements for genetic variation within several South Asian and African populations (24% and 28% of novel variants respectively) 2. Most of the low-frequency (< 0.5%) variants likely to be of functional significance are disproportionately present in individuals with substantial African ancestry, indicating bottlenecks in non-African populations 2, 3. The “Luhya in Webuye, Kenya” (LWK) population has the most accentuated number of these rare variants.
Paucity of data from African populations has restricted understanding of the heritable human genome variation. Although under-represented in human genetic studies, Africa has sizeable genetic, cultural and linguistic diversity (> 2000 distinct ethno-linguistic groups) 4. African populations are more genetically diverse, with considerable population substructure, and lower linkage disequilibrium (LD) compared to non-African populations 4, 5. Inclusion of more African populations will improve understanding of genetic variation attributed to complex population history, variations in climate, lifestyles, exposure to infectious diseases, and diets 4, 6. Diverse multi-ethnic imputation panels will undoubtedly improve fine-mapping of complex traits and provide detailed insights on disease susceptibility, drug responses, and improve therapeutic treatments. One such integrated panel, consisting of the phase 1 1000GP and African Genome Variation Project (AGVP) whole genome sequence panels, has shown marked improvement in detecting association signals in specific African populations poorly represented in the 1000GP 7. AGVP also present a new genotype array design that captures genetic variation in African populations.
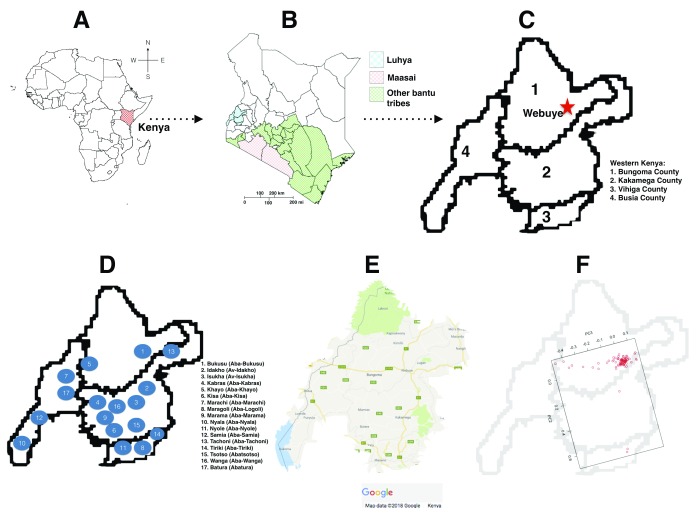
The Human Heredity and Health in Africa (H3Africa) initiative is aimed at understanding health problems relevant to African populations, and titling the scales of data deficit and lacking expertise in health-related genomics among African scientists 8, 9. The H3Africa consortium consists of over 500 members, from more than 30 of the 55 African countries. H3Africa projects are focused on establishing genetic and environmental determinants associated with infectious (human African trypanosomiasis, tuberculosis, HIV, and other respiratory tract infections) and non-communicable diseases (kidney disease, diabetes, and cardiovascular diseases) 10. H3Africa is driven by African investigators, and is anticipated to close the gaps of ‘missing’ heritability by increasing the number of causal variants identified within genes, from a dataset of over 70,000 individuals collected using standardized protocols 8, 10. This presents a unique opportunity for the investigators to not only develop and direct their independent research agendas, but also enrich the datasets using their extensive knowledge of the continent’s history. However, careful consideration of the sampled populations in the H3Africa projects is required to maximise the prospects of identifying and fine-mapping novel risk variants in indigenous populations. In order to translate genomic research findings to useful resources for clinicians and drug development, substantial knowledge about reference populations that are relevant to the individuals being treated alongside the actionable variants is required 10. This is in addition to harmonised and well curated phenotype data that will allow easy integration and direct comparison of data outputs across different cohorts and phenotypes. Attentiveness to the considerable genetic substructure in African population may reveal uncaptured variation and distinct ancestry 11. This extensive genetic diversity would benefit from strategies that explore genomics datasets that put local populations in context to provide more detail from disease mapping efforts in Africa. An example is the LWK in the 1000GP who do not represent all the “Luhya people”, a Bantu-speaking Niger-Congo population with a complex population history composed of 17 tribes, each with a distinct dialect ( Figure 1) 12. We examined for possible substructure in LWK, from 1000GP, to establish its implication on association studies.
Figure 1. The geographic distribution of Luhya in Webuye, Kenya individuals.
( A) Map of Africa showing the location of Kenya. ( B) Map of Kenya showing the location of Western Kenya Counties. ( C) Counties in Western Kenya inhabited by the “ Luhya people”. ( D) The 17 tribes of the Luhya, and the locations they hail from in Western Kenya. ( E) Map showing major routes in Western Kenya. Most settlements are along major routes, and in small towns at their intersections. ( F) PC3 reflects the geographic distribution of the individuals, while the first two principal components, PC1 and PC2, distinguished individuals primarily on genetic ancestry.
Methods
We used principal component analysis (PCA) to examine relationships within the LWK population (n=99) using 193,634 variants from the 1000GP phase 3 2. The 1000GP call set was already filtered down using VCFtools and PLINK, and only contained biallelic, non-singleton SNV sites that are a minimum of 2KB apart from each other and a minor allele frequency > 0.05 2, 13, 14. We considered just the first three principal components (PCs) computed to resolve the population substructure. We then used ADMIXTURE v1.3 to estimate ancestry for K values from 3 through 20 15. Distruct plots of the output ancestry fractions were generated using STRUCTURE PLOT v2.0 16.
Results and discussion
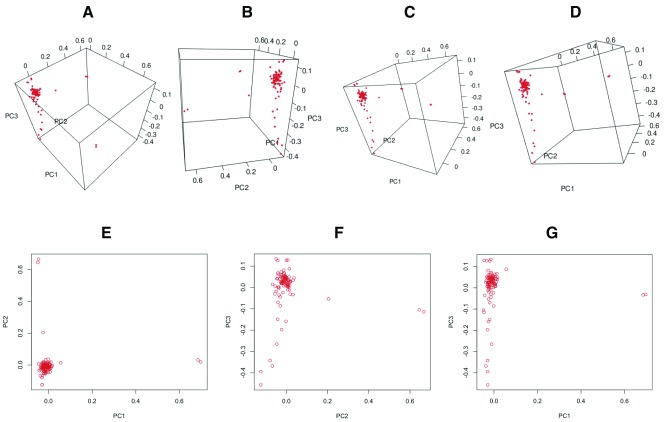
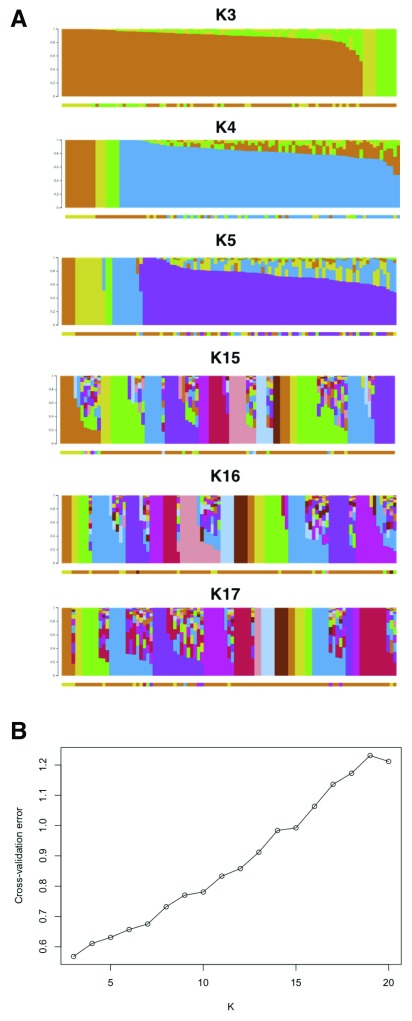
Our PCA analyses reveal that all individuals cluster closely except five individuals along PC1 (n=2) and PC2 (n=3), possibly suggesting that the outliers are individuals from different Luhya tribes. We suggest that whereas the first two principal components, PC1 and PC2, distinguished individuals primarily on genetic ancestry, PC3 reflects the geographic distribution of the individuals ( Figure 2). We propose that although a huge proportion of individuals sampled are actually from Webuye (Bukusu tribe), others hail from various settlements along major routes and smaller towns ( Figure 1E and 1F). Unsupervised ADMIXTURE analysis suggests minimal substructure, and the cross-validation procedure identified K3 as the most plausible K ( Figure 3).
Figure 2. Principal component analysis (PCA) shows relationships within the Luhya in Webuye, Kenya population (n=99) using 193,634 variants from the 1000GP phase 3.
( A– D) The distribution of individuals along the first three principal components. ( E– G) Distribution along two principal components.
Figure 3. Population structure within the Luhya in Webuye, Kenya.
( A). We show the first and last three K values for K=3 through K=20. ( B). The cross-validation procedure identified K=3 as the most plausible K since it had the smallest error value.
GWAS studies largely rely on self-reported data on ethnic background. Genetic information is then used to confirm ancestral backgrounds and exclude outliers. Thus, in order to understand complex traits in say the entire “ Luhya people”, adequate sampling of underrepresented tribes would provide a high-resolution view of their ancestral history. Haphazard sampling would significantly reduce power to detect signal due to population substructure, even within this single community. We speculate that this was largely circumvented at recruitment when sampling LWK by asking the participants whether all four of their grandparents were of the Bukusu tribe. Whereas projects covering relatively small geographical areas are able to overcome such challenges, national and within-continental cohorts in efforts like H3Africa must have well thought out documented protocols that carefully consider human demographic history.
Data availability
The LWK dataset was obtained from the European Bioinformatics Institute 1000 Genomes Project website http://ftp.1000genomes.ebi.ac.uk/vol1/ftp/release/20130502/supporting/admixture_files/
Acknowledgement
This work is published with permission from the University of Nairobi.
Funding Statement
The work was supported by the Wellcome Trust [087540] through a pump-priming grant to BWK from the Training Health Researchers into Vocational Excellence in East Africa (THRiVE) Initiative.
The funders had no role in study design, data collection and analysis, decision to publish, or preparation of the manuscript.
[version 1; referees: 2 approved with reservations]
References
- 1. Sudmant PH, Rausch T, Gardner EJ, et al. : An integrated map of structural variation in 2,504 human genomes. Nature. 2015;526(7571):75–81. 10.1038/nature15394 [DOI] [PMC free article] [PubMed] [Google Scholar]
- 2. 1000 Genomes Project Consortium; Auton A, Brooks LD, et al. : A global reference for human genetic variation. Nature. 2015;526(7571):68–74. 10.1038/nature15393 [DOI] [PMC free article] [PubMed] [Google Scholar]
- 3. Marth G, Schuler G, Yeh R, et al. : Sequence variations in the public human genome data reflect a bottlenecked population history. Proc Natl Acad Sci U S A. 2003;100(1):376–381. 10.1073/pnas.222673099 [DOI] [PMC free article] [PubMed] [Google Scholar]
- 4. Campbell MC, Tishkoff SA: African genetic diversity: implications for human demographic history, modern human origins, and complex disease mapping. Annu Rev Genomics Hum Genet. 2008;9:403–433. 10.1146/annurev.genom.9.081307.164258 [DOI] [PMC free article] [PubMed] [Google Scholar]
- 5. Tishkoff SA, Dietzsch E, Speed W, et al. : Global patterns of linkage disequilibrium at the CD4 locus and modern human origins. Science. 1996;271(5254):1380–1387. 10.1126/science.271.5254.1380 [DOI] [PubMed] [Google Scholar]
- 6. Gomez F, Hirbo J, Tishkoff SA: Genetic variation and adaptation in Africa: implications for human evolution and disease. Cold Spring Harb Perspect Biol. 2014;6(7):a008524. 10.1101/cshperspect.a008524 [DOI] [PMC free article] [PubMed] [Google Scholar]
- 7. Gurdasani D, Carstensen T, Tekola-Ayele F, et al. : The African Genome Variation Project shapes medical genetics in Africa. Nature. 2015;517(7534):327–332. 10.1038/nature13997 [DOI] [PMC free article] [PubMed] [Google Scholar]
- 8. H3Africa Consortium; Rotimi C, Abayomi A, et al. : Research capacity. Enabling the genomic revolution in Africa. Science. 2014;344(6190):1346–1348. 10.1126/science.1251546 [DOI] [PMC free article] [PubMed] [Google Scholar]
- 9. Mulder NJ, Adebiyi E, Alami R, et al. : H3ABioNet, a sustainable pan-African bioinformatics network for human heredity and health in Africa. Genome Res. 2016;26(2):271–277. 10.1101/gr.196295.115 [DOI] [PMC free article] [PubMed] [Google Scholar]
- 10. Mulder N, Abimiku A, Adebamowo SN, et al. : H3Africa: current perspectives. Pharmgenomics Pers Med. 2018;11:59–66. 10.2147/PGPM.S141546 [DOI] [PMC free article] [PubMed] [Google Scholar]
- 11. Retshabile G, Mlotshwa BC, Williams L, et al. : Whole-Exome Sequencing Reveals Uncaptured Variation and Distinct Ancestry in the Southern African Population of Botswana. Am J Hum Genet. 2018;102(5):731–743. 10.1016/j.ajhg.2018.03.010 [DOI] [PMC free article] [PubMed] [Google Scholar]
- 12. Coriell Institute: Luhya in Webuye, Kenya [LWK]. 2018;2018 Reference Source [Google Scholar]
- 13. Danecek P, Auton A, Abecasis G, et al. : The variant call format and VCFtools. Bioinformatics. 2011;27(15):2156–2158. 10.1093/bioinformatics/btr330 [DOI] [PMC free article] [PubMed] [Google Scholar]
- 14. Chang CC, Chow CC, Tellier LC, et al. : Second-generation PLINK: rising to the challenge of larger and richer datasets. GigaScience. 2015;4:7. 10.1186/s13742-015-0047-8 [DOI] [PMC free article] [PubMed] [Google Scholar]
- 15. Alexander DH, Lange K: Enhancements to the ADMIXTURE algorithm for individual ancestry estimation. BMC Bioinformatics. 2011;12:246. 10.1186/1471-2105-12-246 [DOI] [PMC free article] [PubMed] [Google Scholar]
- 16. Ramasamy RK, Ramasamy S, Bindroo BB, et al. : STRUCTURE PLOT: a program for drawing elegant STRUCTURE bar plots in user friendly interface. Springerplus. 2014;3:431. 10.1186/2193-1801-3-431 [DOI] [PMC free article] [PubMed] [Google Scholar]


