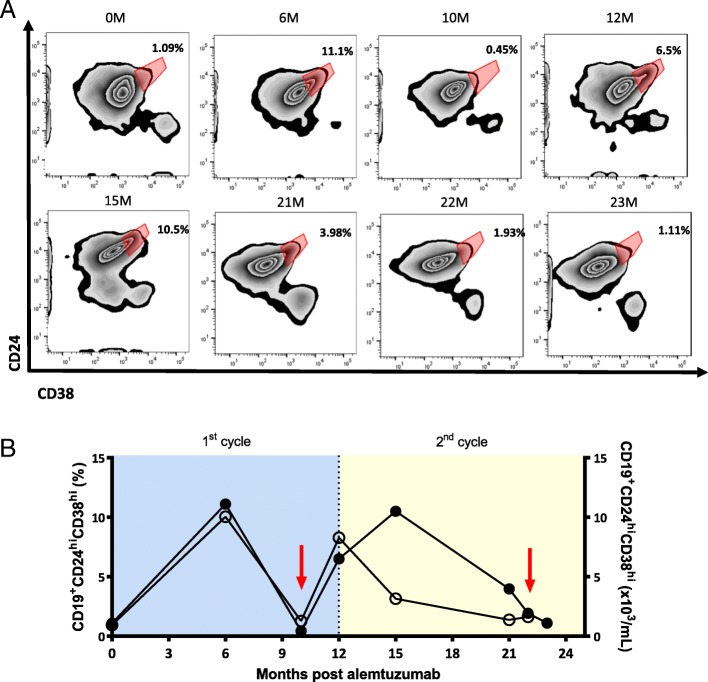
Fig. 6.
The frequency of CD19+CD24hiCD38hi cells is decreased during relapse post alemtuzumab treatment. a Flow-cytometry plot of expression of CD24 and CD38 in total CD19+ B cells. b Graph showing the clinical course. The frequency and the absolute number of CD19+CD24hiCD38hi B cells and infusion of 2 cycles of alemtuzumab are shown. Filled circles indicate the frequency of CD19+CD24hiCD38hi B cells, and hollow circles indicate the absolute number of CD19+CD24hiCD38hi B cells. Red arrow indicates relapse

