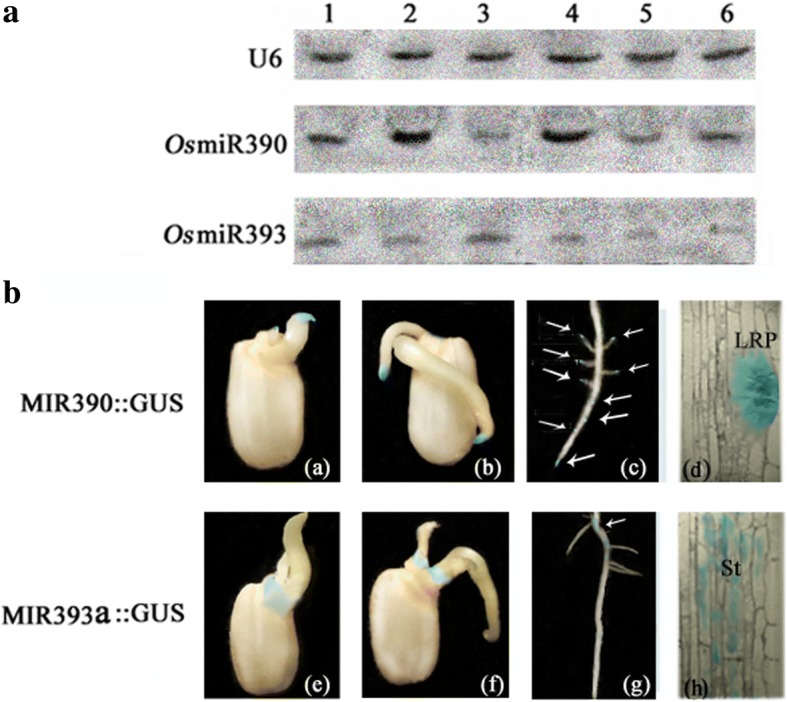
Fig. 1.

The expression patterns of miR393 and miR390 in rice. (a) Tissue expression pattern. For small RNA gel blots, 50 μg of total RNA was loaded and the blots were probed for miR390, miR393 and U6 RNA (as a loading control). The lanes represent the tested tissues of 2-week-old seedlings (lane1), lateral root primordia (lane 2), the base part of root (lane 3), 5-mm-long roots tips of 4-week-old-seedlings (lane4), the base part of shoot in 4-week-old-seedlings (lane 5), and flowers (lane 6), respectively. (b) GUS staining pattern of the transgenic rice MIR390::GUS and MIR393a::GUS. GUS is visualized in blue. The staining is observed in the 3-d-germinated seeds (a and e), 5-d-germinated seedlings (b and f), primary root of 3-week-old seedlings (c and g). semi-thin slices of 2-week-old primary root (d and h). LRP: lateral root primordia; St: stele, Bars = 2 cm [(a), (b), (c), (e), (f), (g)]; Bars = 50 μm [(d) and (h)].
