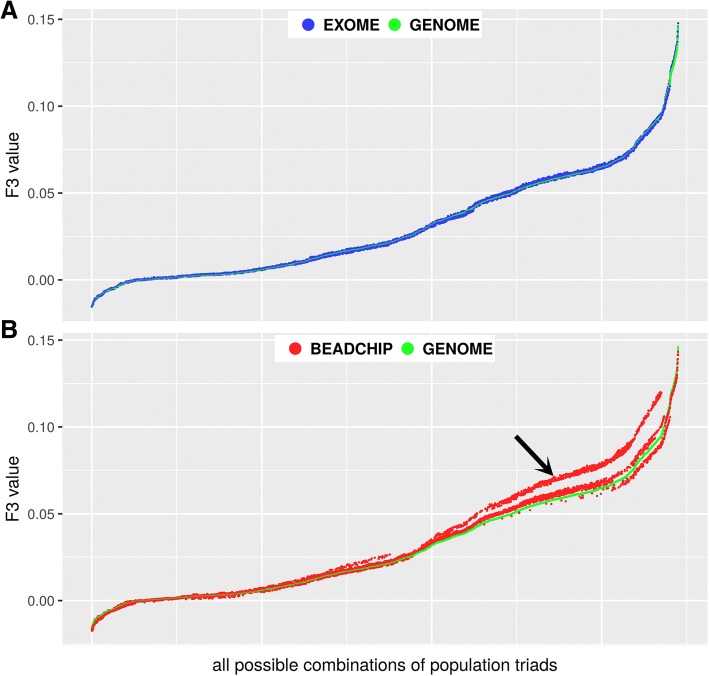
Fig. 3.
Comparison of F3 values obtained from the GENOME, EXOME and BEADCHIP datasets. F3 values were ordered and plotted relative to all possible combinations of population triads. a) F3 values from the EXOME vs. the GENOME dataset b) F3 values from the BEADCHIP vs. the GENOME dataset. The arrow denotes substantial deviations from the GENOME F3 values

