Figure 5.

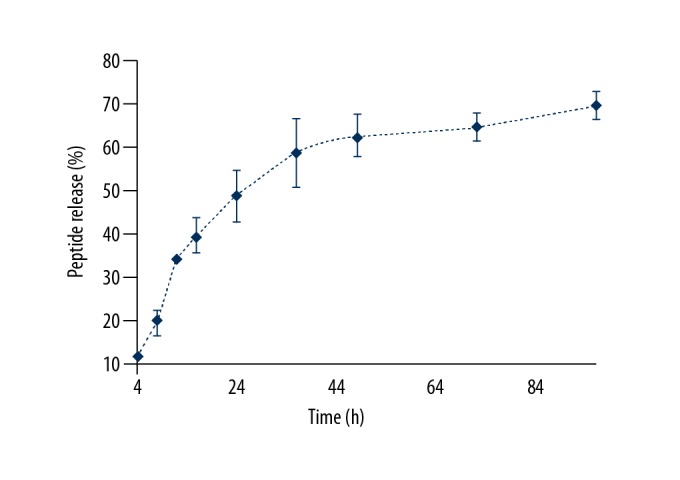
Profile of the percentage release of peptide with time. The experiments were carried out in three biological replicates and expressed as the mean ± standard deviation (SD).

Profile of the percentage release of peptide with time. The experiments were carried out in three biological replicates and expressed as the mean ± standard deviation (SD).