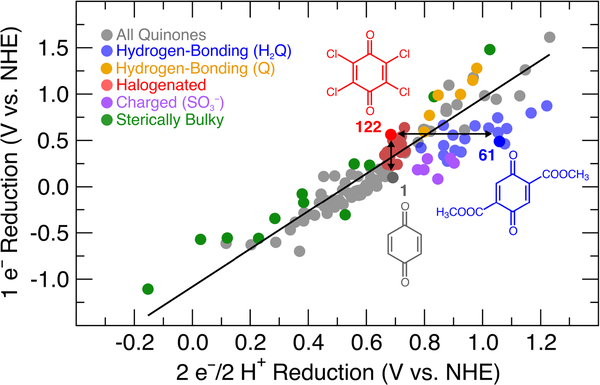
Figure 4.
Plot of the 1 e– reduction potentials versus the 2 e–/2 H+ reduction potentials for the quinones in Chart 2, with colors identifying the physical basis for deviations from the global linear trend. The line was generated by a linear fit to only the gray data points.

