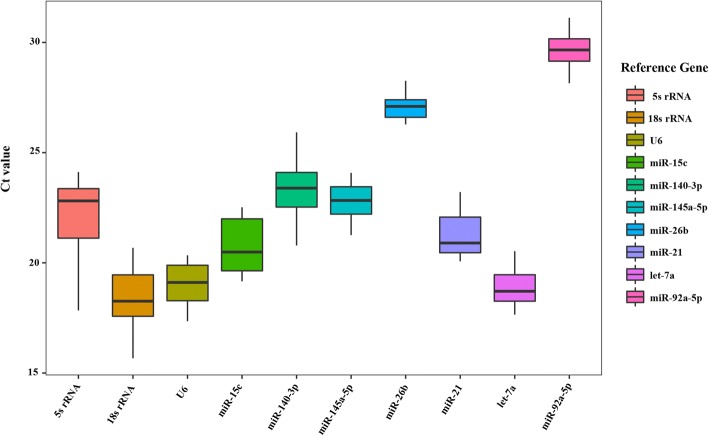
Fig. 9.
Box plot of the Ct values of the candidate reference genes. Note: Each box represents an internal candidate gene, with horizontal lines representing the median, the top of the box representing the third quartile, the bottom representing the first quartile, and lines crossing the box representing maximum and minimum values

