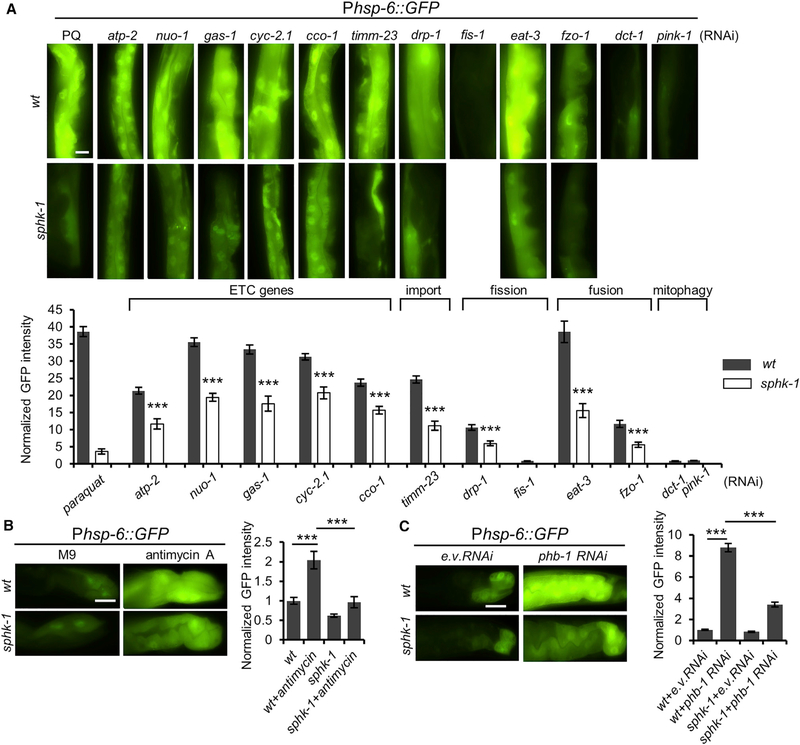
Figure 2. SPHK-1 Activates the UPRmt Induced by Diverse Mitochondrial Stressors.
(A) Representative images and quantification of intestinal Phsp-6::GFP in wild-type and sphk-1 mutants treated with paraquat, atp-2, nuo-1, gas-1, cyc-2.1, cco-1 (ETC genes), timm-23 (translocase), drp-1, fis-1 (mito-fission), eat-3, fzo-1 (mito-fusion), or dct-1, pink-1 (mitophagy) RNAi.
(B) Representative images and quantification of Phsp-6::GFP expression in wild-type or sphk-1 mutants in the absence or presence of antimycin A in intestinal cells
(C) Representative images and quantification of Phsp-6::GFP expression in wild-type or sphk-1 mutant intestines treated with empty vector control (e.v.) or phb-1/ prohibitin1 RNAi.
Scale bar represents 10 μm. Error bars indicate ± SEMs. The sample size (n) and ± SEMs are listed in Table S1. Student’s t test; ***p < 0.001.

