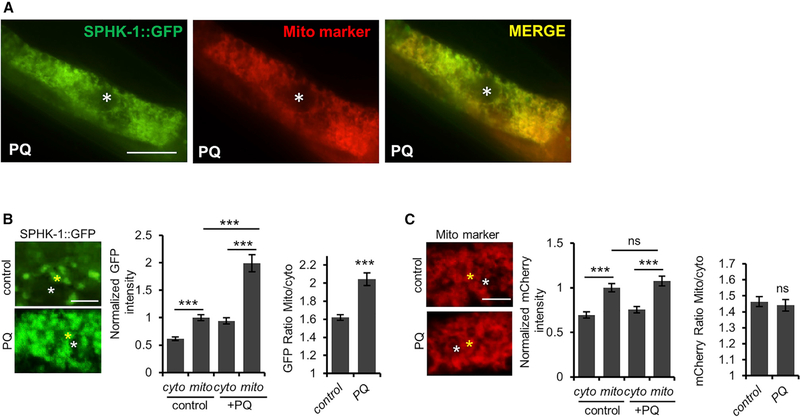
Figure 4. Mitochondrial Stress Promotes Mitochondrial SPHK-1 Accumulation.
(A) Representative intestinal images of animals co-expressing SPHK-1::GFP and mito-marker TOMM-20::mCherry following 24-hr paraquat treatment. Scale barrepresents 10 μm. Asterisk indicates intestinal nucleus.
(B) Representative images of intestinal SPHK-1::GFP in the absence or presence of paraquat. The yellow asterisk marks the reticulated region within the intestinal cells used to quantify mitochondrial SPHK-1::GFP abundance. The white asterisk marks the region in between mitochondria used to quantify cytosolic SPHK1::GFP abundance (left). Average GFP fluorescence intensity of mitochondrial or cytoplasmic SPHK-1::GFP is quantified (center). The ratio of mitochondrial-tocytosolic SPHK-1::GFP fluorescence is quantified (right). Scale bar indicates 2 mm.
(C) Representative images and quantification of TOMM-20::mCherry in intestinal cells in the absence or presence of paraquat. See (B) for details. Scale barindicates 2 μm.
The sample sizes (n) and ±SEMs are listed in Table S1. Error bars indicate ± SEMs. Student’s t test; p < 0.001

