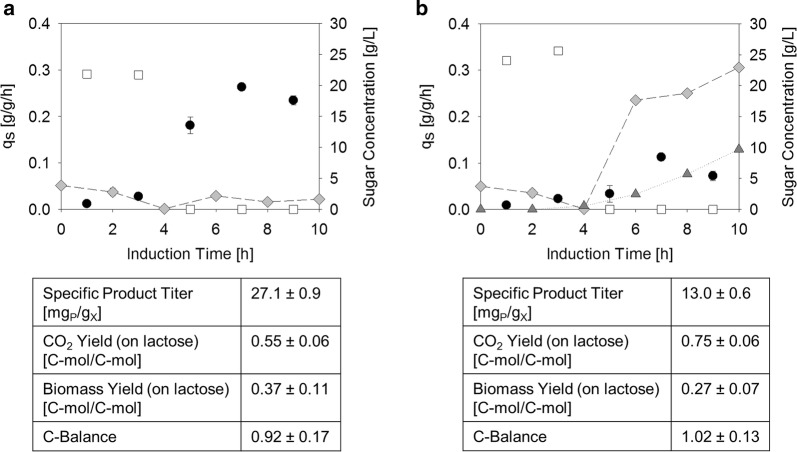
Fig. 3.
Comparison of a HMS174(DE3) and b BL21(DE3) on an induced lactose fed-batch regarding productivity of FHT and physiological parameters. Lactose (grey diamonds) was pulsed to 5 g/L while glucose was still fed for 4 h at a specific glucose uptake rate (white squares) of 0.27 g/g/h. After 4 h, the glucose feed was switched off and lactose was depleted. Then a lactose feed was started at a rate that exceeded the maximum specific lactose uptake rate (black dots) so that lactose was always present in excess. In the BL21(DE3) cultivation galactose (dark grey triangles) started to accumulate after the lactose feed was started. FHT production and physiological parameters are shown below and are calculated as average during the 6 h of lactose feeding. Standard deviations were evaluated from triple measurements and calculated by error propagation

