Fig. 5.

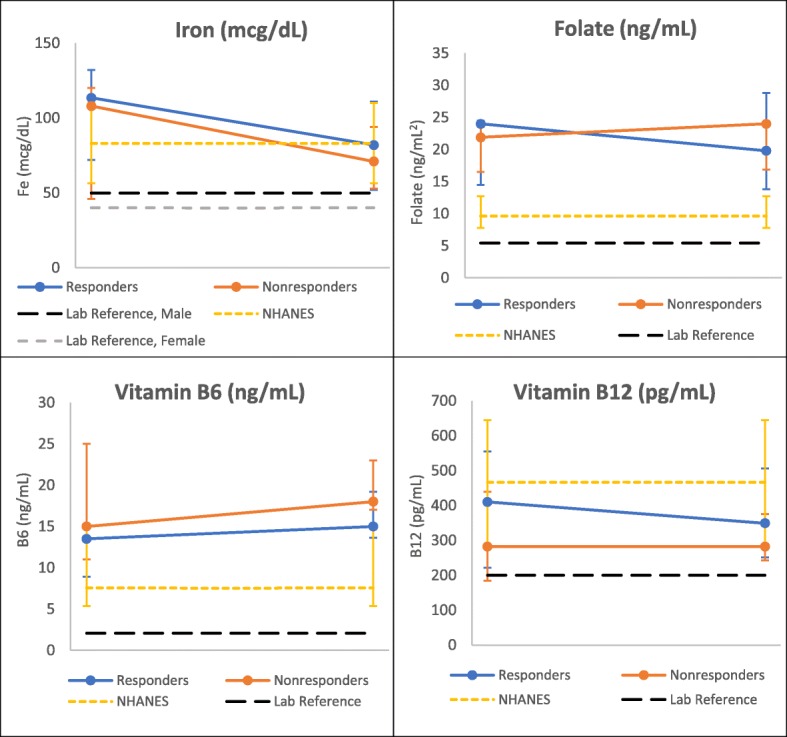
Change in Laboratory Micronutrients over One Year by Response Group, ≥18 years. δ NHANES data represents a single time point of collection and laboratory reference given as lower limit

Change in Laboratory Micronutrients over One Year by Response Group, ≥18 years. δ NHANES data represents a single time point of collection and laboratory reference given as lower limit