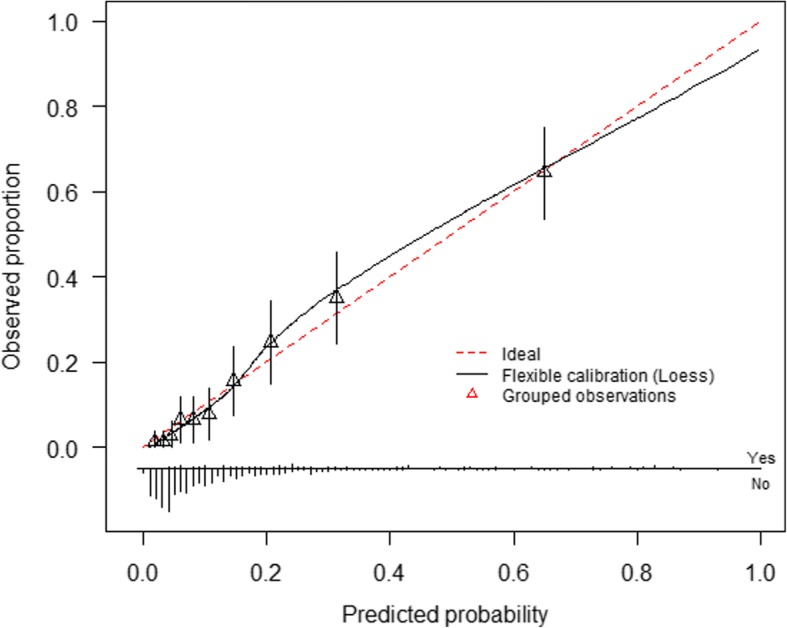
Fig. 3.

Calibration plot of CIPHER (Collaborative Integrated Pregnancy High-dependency Estimate of Risk) model developed using the pooled predicted probabilities of outcome for each woman in the 10 imputed datasets. The smooth line represents fit of the model predicted risk of outcome to the observed rate within each decile of predicted probability. The straight diagonal line is used as reference for perfect fit. The bar chart at the base of the figure presents distribution of cases with outcomes (above the line) and without cases (below the line) across the spectrum of predicted probability
