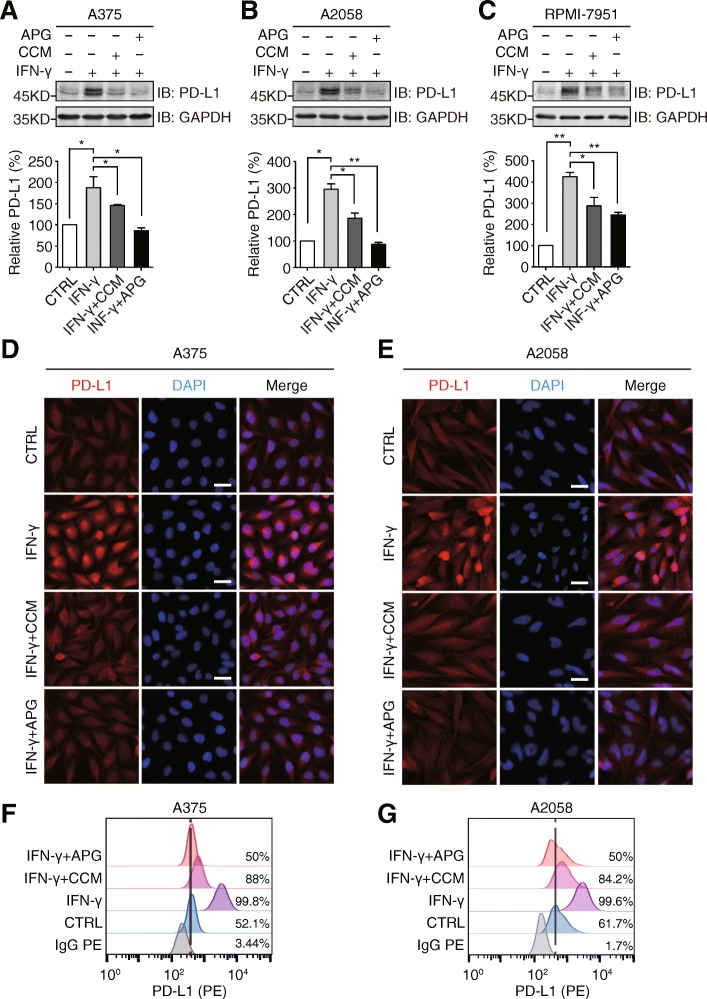
Fig. 3.
Apigenin and curcumin suppress IFN-γ-induced PD-L1 expression in human melanoma cells. a-c indicated melanoma cells were pretreated with DMSO, curcumin (25 μM), or apigenin (30 μM) for 4 h and then treated with IFN-γ (10 ng/ml) for 24 h. Cells were lysed and PD-L1 expression was detected by Western blotting using a PD-L1 antibody. GAPDH was used as a loading control. Column charts below show quantitation data of relative PD-L1 expression. Error bars represent the mean ± S.D. (n = 3, *P < 0.05 and **P < 0.01). d and e cells were treated as described above and processed for immunofluorescence analysis. Representative micrographs show PD-L1 staining from different groups with same intensity settings on a fluorescent microscope (Olympus, Japan). DAPI stains nucleus. Scale bar = 25 μm. f and g, A375 and A2058 cells were treated as described above, and cell surface PD-L1 expression was determined by flow cytometry

